
The ANPELA provides an open assess online service enabling (1) the label-free proteome quantification (LFQ) based on three quantification measurements SWATH-MS, Peak Intensity and Spectral Counting, (2) the evaluation of LFQ performances from multiple perspectives and (3) the identification of the optimal LFQs based on comprehensive performance ranking. It not only AUTOMATICALLY detects the diverse formats of data generated by all quantification software, but also provides the most complete set of processing methods among available tools, which including the methods of transformation, pretreatment (centering, scaling & normalization) and missing value imputation.
Citing the ANPELA:
Tang J, Fu J, Wang Y, Li B, Li Y, Yang Q, Cui X, Hong J, Li X, Chen Y, Xue W, Zhu F*. ANPELA: analysis and performance-assessment of the label-free quantification workflow for metaproteomic studies. Brief Bioinform 21(2): 621-636 (2020). PMID: 30649171
Tang J, Fu J, Wang Y, Luo Y, Yang Q, Li B, Tu G, Hong J, Cui X, Chen Y, Yao L, Xue W, Zhu F*. Simultaneous improvement in the precision, accuracy and robustness of label-free proteome quantification by optimizing data manipulation chains. Mol Cell Proteomics 18(8): 1683-1699 (2019). PMID: 31097671
Thanks a million for using and improving ANPELA, and welcome to visit our lab at https://idrblab.org/.
ANPELA is Designed to Facilitate the Cutting-edge Research of Proteome Quantification by:
Accepting the Data Generated by Various Quantification Tools Pre-processing the Raw Data Acquired by 3 Quantification Measurements
A variety of data generated by 18 quantification tools which are popular for pre-processing raw proteomic data are accepted by ANPELA, which include DIA-UMPIRE, OpenSWATH, PeakView, Skyline, Spectronaut (for SWATH-MS), MaxQuant, MFPaQ, OpenMS, PEAKs, Progenesis QI, Proteios SE, Scaffold, Thermo Proteome Discoverer (for Peak Intensity), and Abacus, Census, DTASelect, IRMa-hEIDI, MaxQuant, MFPaQ, ProteinProphet, Scaffold (for Spectral Counting). When uploaded to ANPELA, the corresponding data format produced by a specific quantification tool can be AUTOMATICALLY detected. Moreover, if users would like to assess the LFQ data generated by their in-house tool or pre-defined analytical workflow, a unified format ( Right Click to Save) designed by ANPELA is also accepted.

Providing the Most Diverse Set of Methods Sequentially Applied to Process Proteomic Data
3 methods for transformation (Box-cox, Log, VSN); 18 methods for pretreatment: (1) Mean, Median (centering), (2) Auto, Pareto, Range, Vast (scaling) & (3) Cyclic Loess, EigenMS, Linear Baseline Scaling, Locally Weighted Scatterplot Smoothing, Mean Norm, Median Absolute Deviation, Median Norm, PQN, Quantile, Robust Linear Regression, TIC, TMM (normalization); 7 methods for missing value imputation (Background, BPC, Censored, KNN, LLS, SVD and Zero) are included and sequentially applied in ANPELA. All these manipulation methods are frequently used to process the label-free proteomic data.

Comprehensively Assessing the Performance of Label-free Quantification (LFQ) from Multiple Perspectives
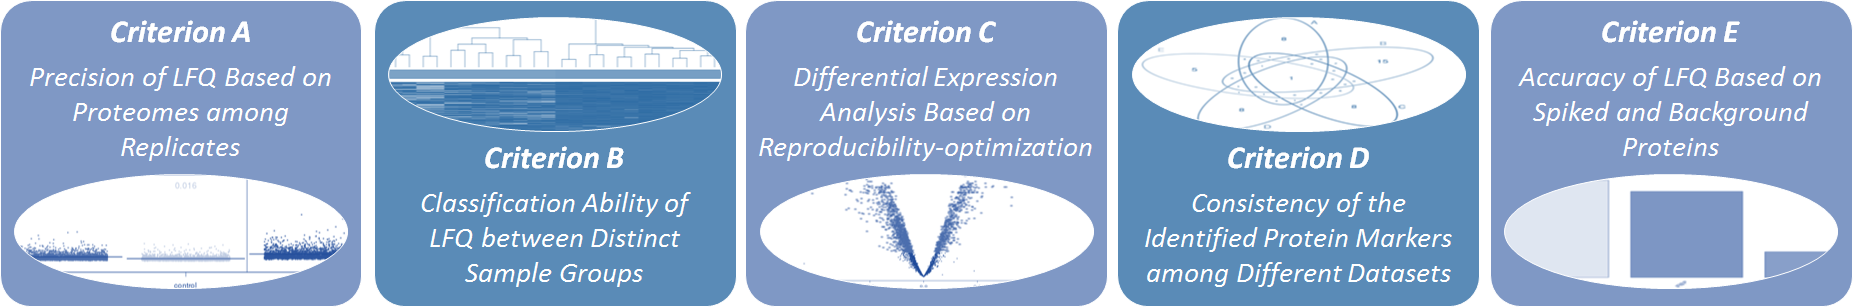
5 well-established criteria are provided to comprehensively assess the performance of LFQ: (Criterion A) Precision of LFQ based on the proteomes among replicates (Navarro P, et al. Nat Biotechnol. 34(11):1130-1136, 2016; Kuharev J, et al. Proteomics. 15(18):3140-3151, 2015), (Criterion B) Classification ability of LFQ between distinct sample groups (Griffin NM, et al. Nat Biotechnol. 28(1):83-89, 2010), (Criterion C) Differential abundance analysis in proteomics based on reproducibility-optimization (V?likangas T, et al. Brief Bioinform. 19(6):1344-1355, 2018), (Criterion D) Robustness of the identified protein markers among different datasets (Li B, et al. Nucleic Acids Res. 45(W1):162-170, 2017), and (Criterion E) Accuracy of LFQ based on spiked and background proteins (Dowle AA, et al. J Proteome Res. 15(10):3550-3562, 2016; Navarro P, et al. Nat Biotechnol. 34(11):1130-1136, 2016).
Each criterion assesses the performance of LFQ based on their distinct underlying theory, and the combination of multiple criteria can thus provide a much more comprehensive evaluation on the studied LFQ than any single criterion. The evaluation results of all these criteria and the corresponding metrics are displayed on the web page, and all figures and tables can be downloaded from the website.
Summary and Visualization of the Uploaded Raw Data
The Label File is Successfully Uploaded, Please Upload the Corresponding Data File Generated by Popular Software of the Selected MOA
Summary and Visualization of the Uploaded Raw Data
The Label File is Successfully Uploaded, Please Upload the Corresponding Data File Generated by Popular Software of the Selected MOA
Summary and Visualization of the Uploaded Raw Data
The Label File is Successfully Uploaded, Please Upload the Corresponding Data File Generated by Popular Software of the Selected MOA
Instruction to the User
1. Please Choose a Format File Unified by ANPELA in the Left Side Panel
2. Please Process the Uploaded Data by Clicking the “Upload Data” Button in the Left Side Panel
Instruction to the User
1. Please Choose Your Preferred “Mode of Acquisition (MOA)” in the Left Side Panel
SWATH-MS Data (sequential windowed acquisition of all theoretical fragment ion mass spectra)
Sample data file of this MOA could be downloaded HERE, together with an additional label file
Peak Intensity (pre-processing the data acquired based on precursor ion signal intensity)
Spectral counting (pre-processing the data acquired based on MS2 spectral counting)
Sample data file of this MOA could be downloaded HERE, together with an additional label file
2. Please Upload the Data File Generated by Popular Software of the Selected MOA in the Left Side Panel
3. Please Upload the Label File Indicating the Classes of Each Sample in the Left Side Panel
4. Please Process the Uploaded Data by Clicking the “Upload Data” Button in the Left Side Panel
Summary and Visualization of Raw Data
A. Summary of the Raw Data

B. Distribution of Protein Intensities Before and After Log Transformation
Summary and Visualization of the Uploaded Raw Data
A. Summary of the Raw Data
B. Distribution of Protein Intensities Before and After Log Transformation
Summary and Visualization of the Uploaded Raw Data
The Data File is Successfully Uploaded, which is Recognized as the Resulting Data File Generated by the Quantification Software:
Please Upload the Corresponding Label File Indicating the Classes of Each Sample
Summary and Visualization of the Uploaded Raw Data
The Data File is Successfully Uploaded, which is Recognized as the Resulting Data File Generated by the Quantification Software:
Please Upload the Corresponding Label File Indicating the Classes of Each Sample
Summary and Visualization of the Uploaded Raw Data
The Data File is Successfully Uploaded, which is Recognized as the Resulting Data File Generated by the Quantification Software:
Please Upload the Corresponding Label File Indicating the Classes of Each Sample
A. Summary of the Raw Data
B. Distribution of Protein Intensities Before and After Log Transformation
A. Summary of the Raw Data
B. Distribution of Protein Intensities Before and After Log Transformation
A. Summary of the Raw Data
B. Distribution of Protein Intensities Before and After Log Transformation
Table of Contents
1. Step-by-step Instruction on the Usage of ANPELA
1.1 Uploading Quantification Data
1.2 Data Transformation & Pretreatment
1.3 Data Filtering & Missing Value Imputation
1.4 Performance Assessment of Label-free Quantification from Multiple Perspectives
2. Various Kinds of Quantification Software for Pre-processing Raw Proteomics Data
2.1 Software for Pre-processing the Data Acquired Based on SWATH-MS
2.2 Software for Pre-processing the Data Acquired Based on Peak Intensity
2.3 Software for Pre-processing the Data Acquired Based on Spectral Counting
3. A Variety of Methods for Data Manipulation at Different Manipulation Stages
3.1 Methods for Transformation
3.2 Methods for Pretreatment
3.2.1 Methods for Centering
3.2.2 Methods for Scaling
3.2.3 Methods for Normalization
3.3 Methods for Missing Value Imputation
4. Diverse MS Systems for Proteome Quantification
4.1 AB SCIEX Q-TOF Systems
4.2 Agilent Q-TOF Mass Spectrometer
4.3 Bruker Hybrid Q-TOF Mass Spectrometer
4.4 Thermo Fisher Scientific Orbitrap
5. References
Analysis and subsequent performance assessment are started by clicking on the “Analysis” panel on the homepage of ANPELA. The collection of web services and the whole process provided by ANPELA includes: (Step 1) uploading the quantification data, (Step 2) method's assumption assessment and data transformation & pretreatment, (Step 3) data filtering & missing value imputation, and (Step 4) performance assessment of the proteome quantification.

By click “Upload Quantification Data”, users are allowed to upload their data in various formats generated by popular software tools for label-free quantification. All software tools aim at processing the raw proteomics data acquired by 3 quantification measurements (SWATH-MS, peak intensity and spectral counting). Users are asked to upload the specific file containing the data generated by those tools, together with a label file indicating the classes of each sample (detail information of the file format can be found in the Section 2 of this Manual). Moreover, in case that users want to process their data before ANPELA analysis, they are allowed to upload their processed data in a unified format defined by ANPELA which could be readily found HERE ( Right Click to Save). By clicking the “Upload Data” button, the quantification data provided by the users can be uploaded for further analysis.

Three sets of sample data are also provided in this step facilitating a direct access and evaluation of ANPELA. These sample data are all benchmark datasets collected from the PRoteomics IDEntifications (PRIDE) database developed by the European Bioinformatics Institute. Particularly, the sample data for SWATH-MS is the dataset PXD000672 containing 12 non-tumorous samples and 12 samples of patients with clear cell renal cell carcinoma (Guo T, et al. Nat Med. 21(4):407-413, 2015); the sample data for protein intensity is the dataset PXD005144 with 66 samples of pancreatic cancer patients and 36 samples of chronic pancreatitis patients (Saraswat M, et al. Cancer Med. 6(7):1738-1751, 2017); and the sample data for spectral counting is the dataset PXD001819 providing yeast cell lysat samples of different concentrations (0.5 vs 50 fmol/microgram) acquired by MS2 spectral counting (Ramus C, et al. J Proteomics. 132:51-62, 2016). By clicking the “Load Data” button, the sample dataset selected by the users can be uploaded for further analysis.

The manipulation methods were reported to be based on their own statistical assumption about the data, which might make them inappropriate for manipulating some proteomic data. Taking pretreatment methods as examples, there were generally three types of assumptions: (Assumption A) all proteins were assumed to be equally important; (Assumption B) the level of protein abundance was assumed to be constant among all samples; (Assumption C) the intensities of the vast majority of the proteins were assumed to be unchanged under the studied conditions. Due to these distinct assumptions, some methods may be fundamentally inappropriate for certain dataset and cannot be assessed for the studied datasets. Therefore, before any performance assessment, users should first analyze the nature of their datasets, and then assess and indicate whether the method’s assumption held for these data.
Users are provided with the option to conduct pretreatment on their uploaded data. In total, 3 types of transformation methods frequently applied to manipulate the label-free proteomics data are included. Furthermore, the current version of ANPELA offers 18 pretreatment methods popular for centering, scaling and normalizing the proteomics data. A detail explanation on each method is provided in the Section 3 of this Manual. By clicking the “PROCESS” button, a summary of the processed data and a plot of the intensity distribution before and after data manipulation are automatically generated. All resulting data and figures can be downloaded by clicking the “Download” button. Moreover, the sample outputs of "Summary of the Processed Data" and "Distribution of Protein Intensities" that performs interactively in the same way as real output are provided.

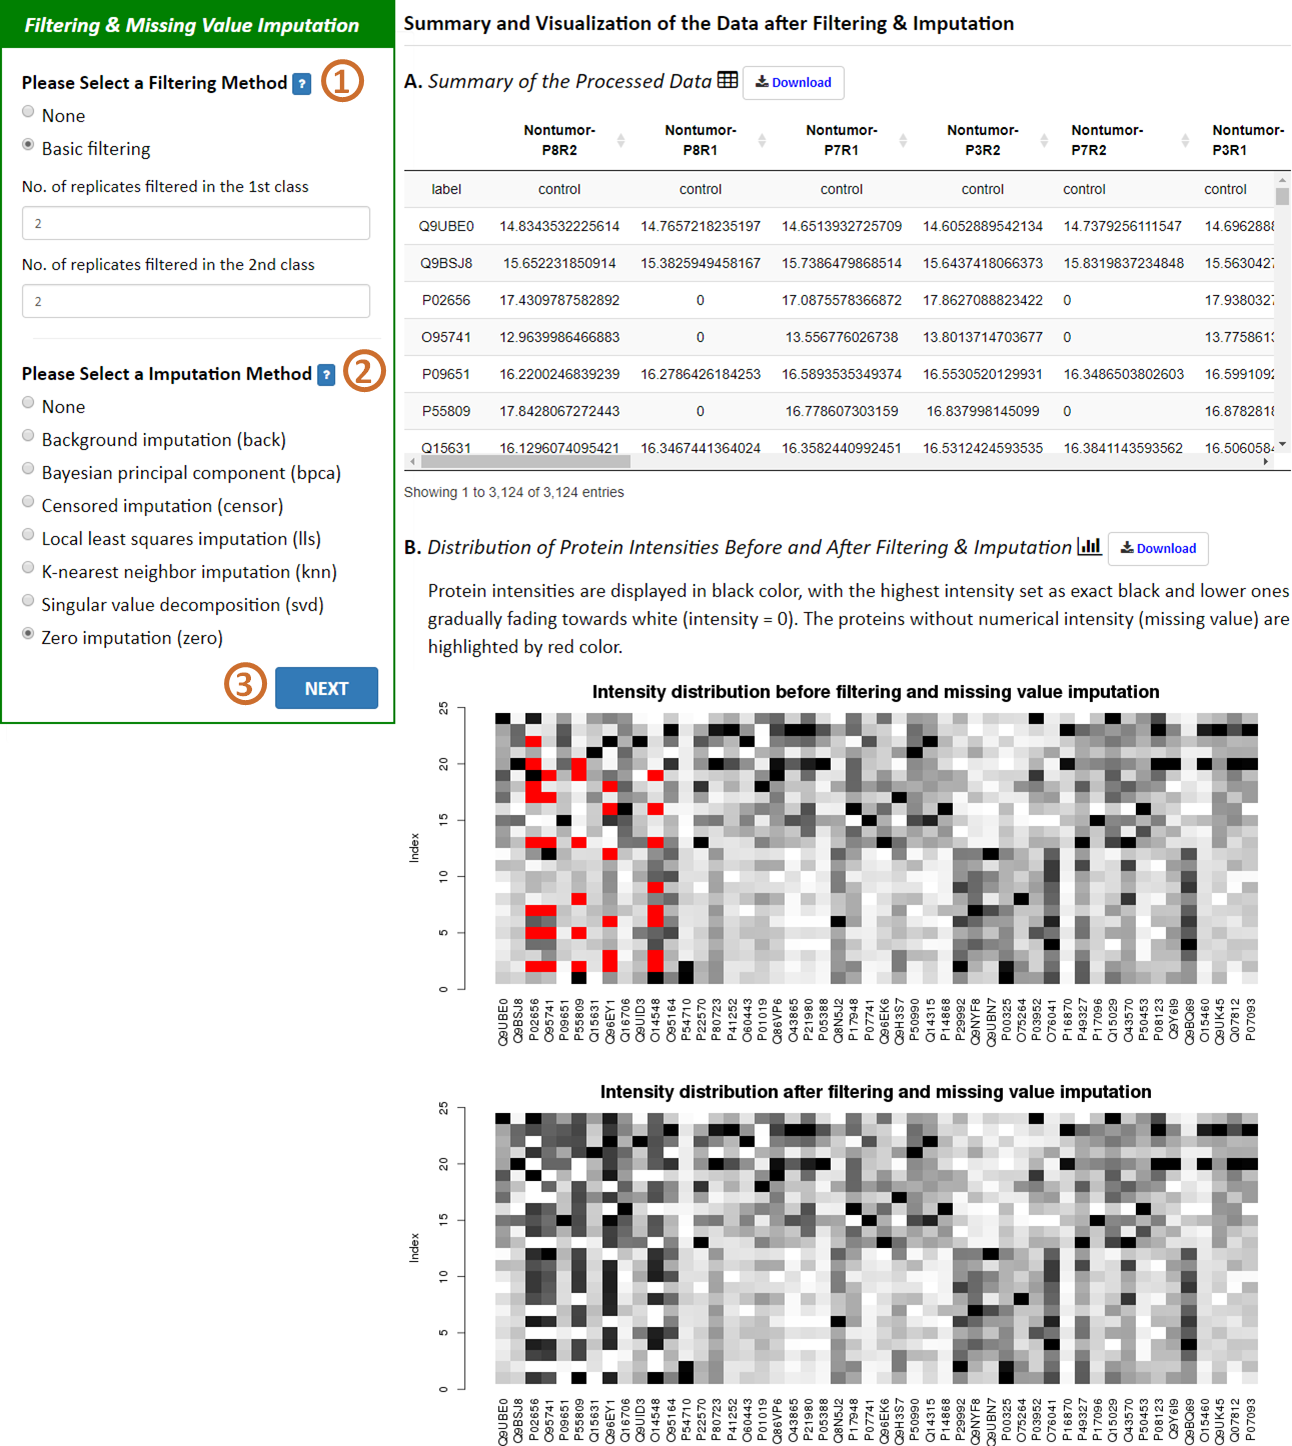
Data filtering and missing value imputation are subsequently provided in this step. The filtering method used here is the basic filtering, and 7 imputation methods frequently applied to treat missing value are covered, which include Background Imputation, Bayesian Principal Component Imputation, Censored Imputation, K-nearest Neighbor Imputation, Local Least Squares Imputation, Singular Value Decomposition and Zero Imputation. A detail explanation on each imputation method is provided in the Section 3 of this Manual. By clicking the “PROCESS” button, a summary of the processed data and a plot of the intensity distribution before and after data manipulation are automatically generated. All resulting data and figures can be downloaded by clicking the “Download” button. Moreover, the sample outputs of "Summary of the Processed Data" and "Distribution of Protein Intensities" that performs interactively in the same way as real output are provided.
Five well-established criteria for a comprehensive evaluation on the performance of LFQ are provided in ANPELA, and each criterion is either quantitatively or qualitatively assessed by various metrics. These criteria include:
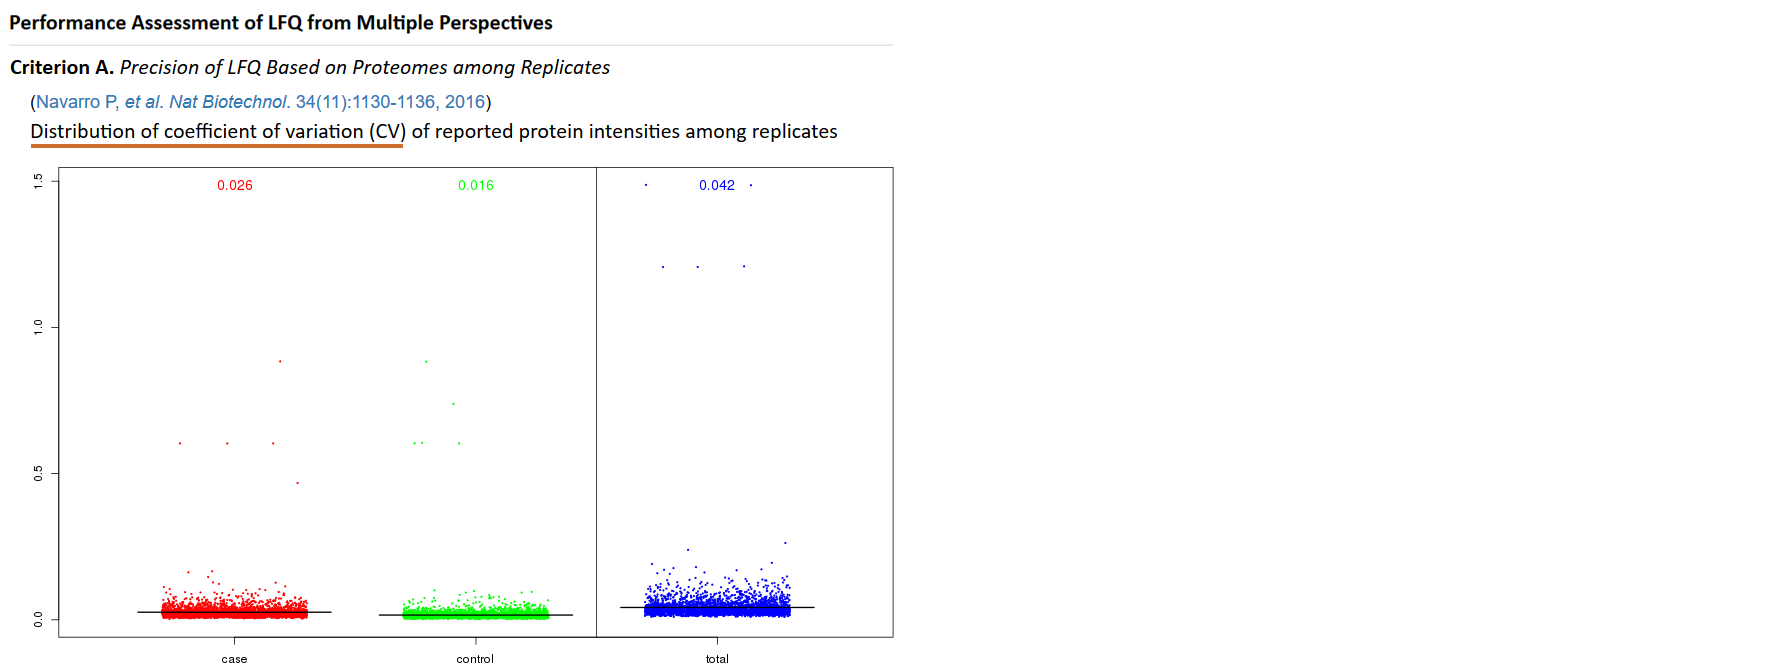
Different quantification measurements, various kinds of software for pre-processing raw proteomics data, and diverse methods for data manipulation profoundly affect the precision of LFQ, which can be assessed by the coefficient of variation (CV) of reported protein intensities among replicates (Navarro P, et al. Nat Biotechnol. 34(11):1130-1136, 2016; Kuharev J, et al. Proteomics. 15(18):3140-3151, 2015). In particular, the metric CV is designed to reflect LFQ’s ability to reduce variation among replicates, and therefore to enhance the technical reproducibility (Chawade A, et al. J Proteome Res. 13(6):3114-3120, 2014). The lower value (illustrated by boxplots below) of CV denotes more thorough removal of experimentally induced noise and indicates better precision of LFQ. Moreover, the sample outputs of "Distribution of CV" that performs interactively in the same way as real output are provided.
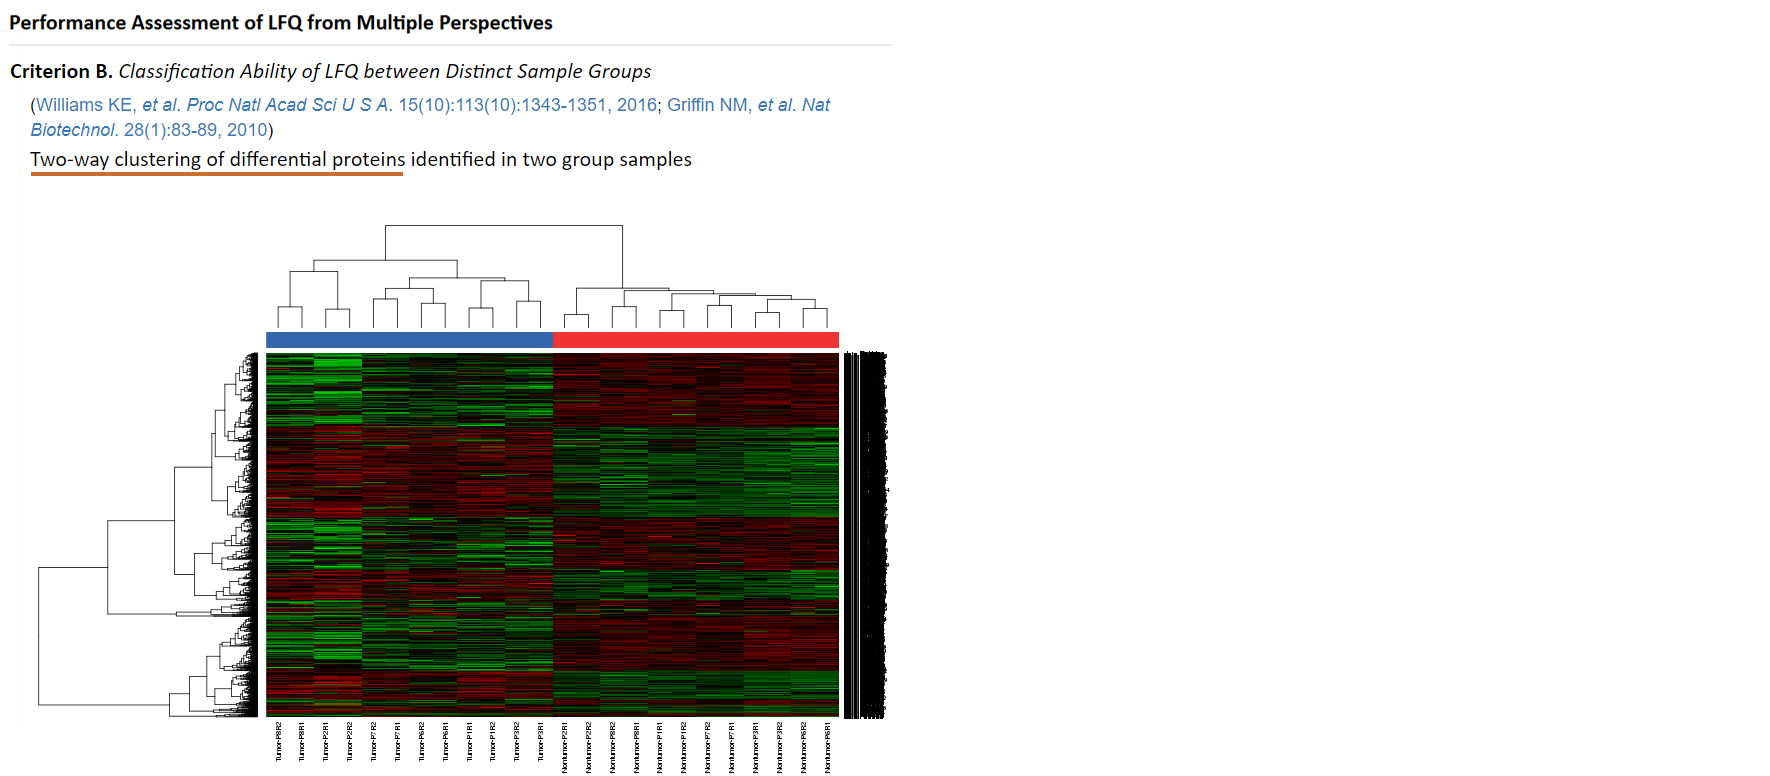
An appropriate LFQ is expected to retain or even enlarge the difference in proteomics data between two distinct sample groups (Griffin NM, et al. Nat Biotechnol. 28(1):83-89, 2010). A heatmap hierarchically clustering samples based on their protein intensities is therefore frequently used as an effective metric to assess LFQ’s classification ability (Griffin NM, et al. Nat Biotechnol. 28(1):83-89, 2010). Firstly, the total number of protein intensities in each sample is reduced by feature selection. Then, proteins (rows) and samples (columns) are clustered based on their similarities in protein intensity profile. Detail process on how to assess LFQ’s classification ability can be found in the prestigious publication by Griffin NM, et al. (Griffin NM, et al. Nat Biotechnol. 28(1):83-89, 2010). Moreover, the sample outputs of "Two-way clustering of differential proteins" that performs interactively in the same way as real output are provided.
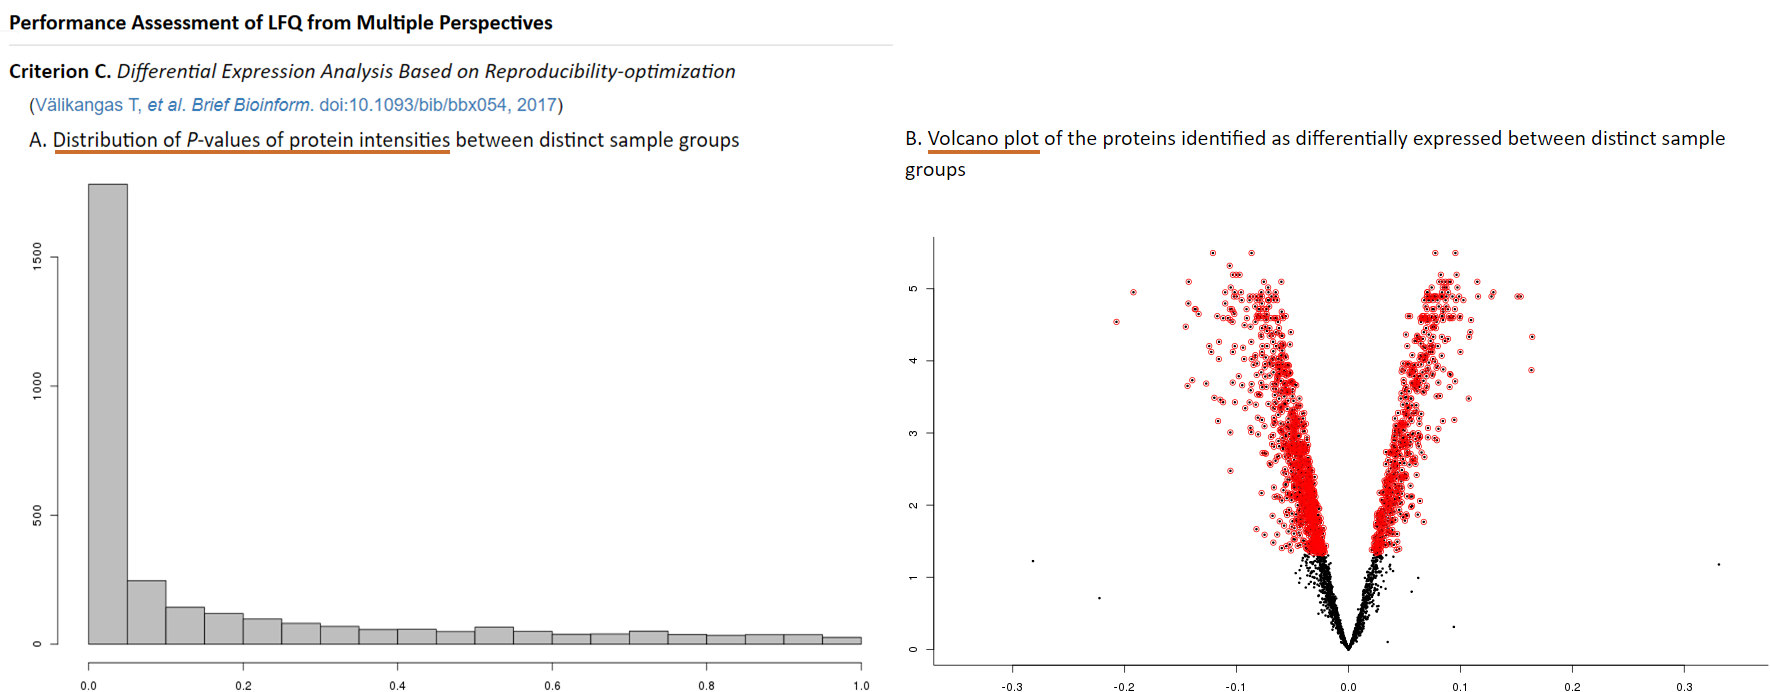
To avoid overfitting or confounding in LFQ, the distribution of P-values of protein intensities between distinct sample groups is examined (Risso D, et al. Nat Biotechnol. 32(9):896-902, 2014). Ideally, one expects a uniform distribution for the bulk of non-differentially expressed proteins, with a peak in the [0.00, 0.05] interval corresponding to proteins with differential intensity (Risso D, et al. Nat Biotechnol. 32(9):896-902, 2014). Moreover, the volcano plot colored proteins with differential intensity can give a glance of the total number of differentially expressed proteins (Välikangas T, et al. Brief Bioinform. doi:10.1093/bib/bbx054, 2017). In the proteomics (and other OMICs) studies that explore the mechanism underlining complex biological process, a limited number of differentially expressed proteins may resulted in false discovery (Blaise BJ. Anal Chem. 85(19):8943-8950, 2013). Therefore, the differential significance of protein intensities between sample groups measured by P-values is firstly calculated using the reproducibility-optimized test statistic (ROTS) package in ANPELA (Pursiheimo A, et al. J Proteome Res. 14(10):4118-4126, 2015). Secondly, the distribution of P-values and the volcano plot are provided. Skewed distribution of P-values may indicate overfitting and/or confounding (Karpievitch YV, et al. BMC Bioinformatics. 13(S16):S5, 2012). Moreover, the sample outputs of "Distriubtion of P-values" and "Volcano plot of protein markers" that perform interactively in the same way as real output are provided.
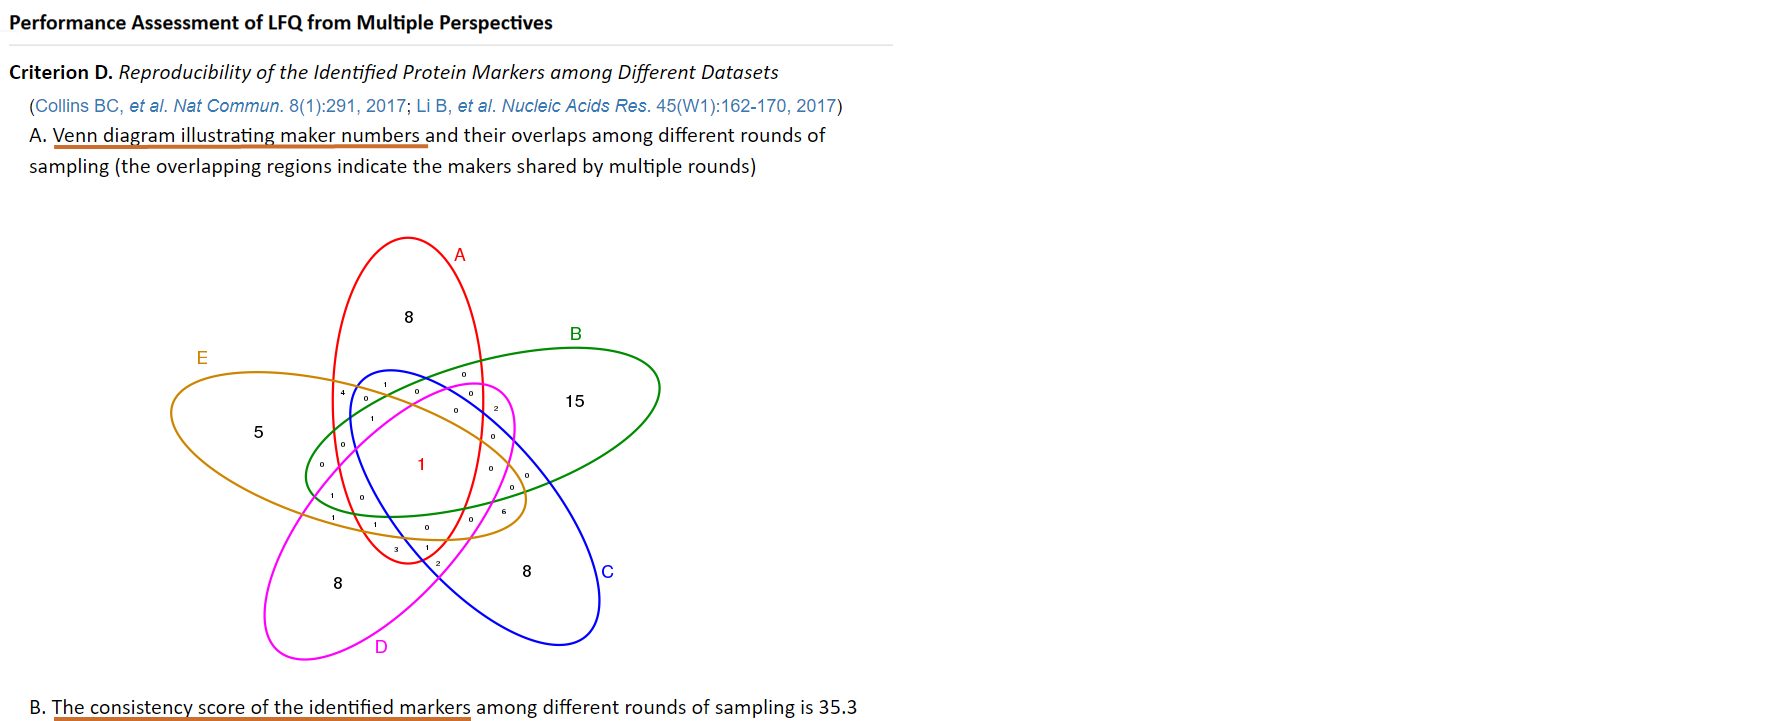
Consistency score is a popular criterion used to represent the robustness of protein marker identification (Li B, et al. Nucleic Acids Res. 45(W1):162-170, 2017), which is calculated to quantitatively measure the overlap of identified protein markers among different partitions of a given dataset (Wang X, et al. Mol Biosyst. 11(5):1235-1240, 2015). The higher consistency score represents the more robust results in protein marker identification (Li B, et al. Nucleic Acids Res. 45(W1):162-170, 2017). Thus, the random sampling is firstly preformed within LFQ dataset to produce multiple sub-datasets. Then, each protein is ranked according to its significance measured by q-value and absolute fold changes. Thirdly, top-ranked proteins in each sub-dataset are selected as markers. Finally, a consistency score is calculated based on these markers using equation (Wang X, et al. Mol Biosyst. 11(5):1235-1240, 2015) as follow:

where C is the total number of sub-datasets, Ii indicates a set of significant protein makers containing the intersections of any i sub-datasets, and nS refers to the number of markers in the intersection S. Moreover, the sample outputs of "Venn diagram illustrating marker numbers" that performs interactively in the same way as real output are provided.
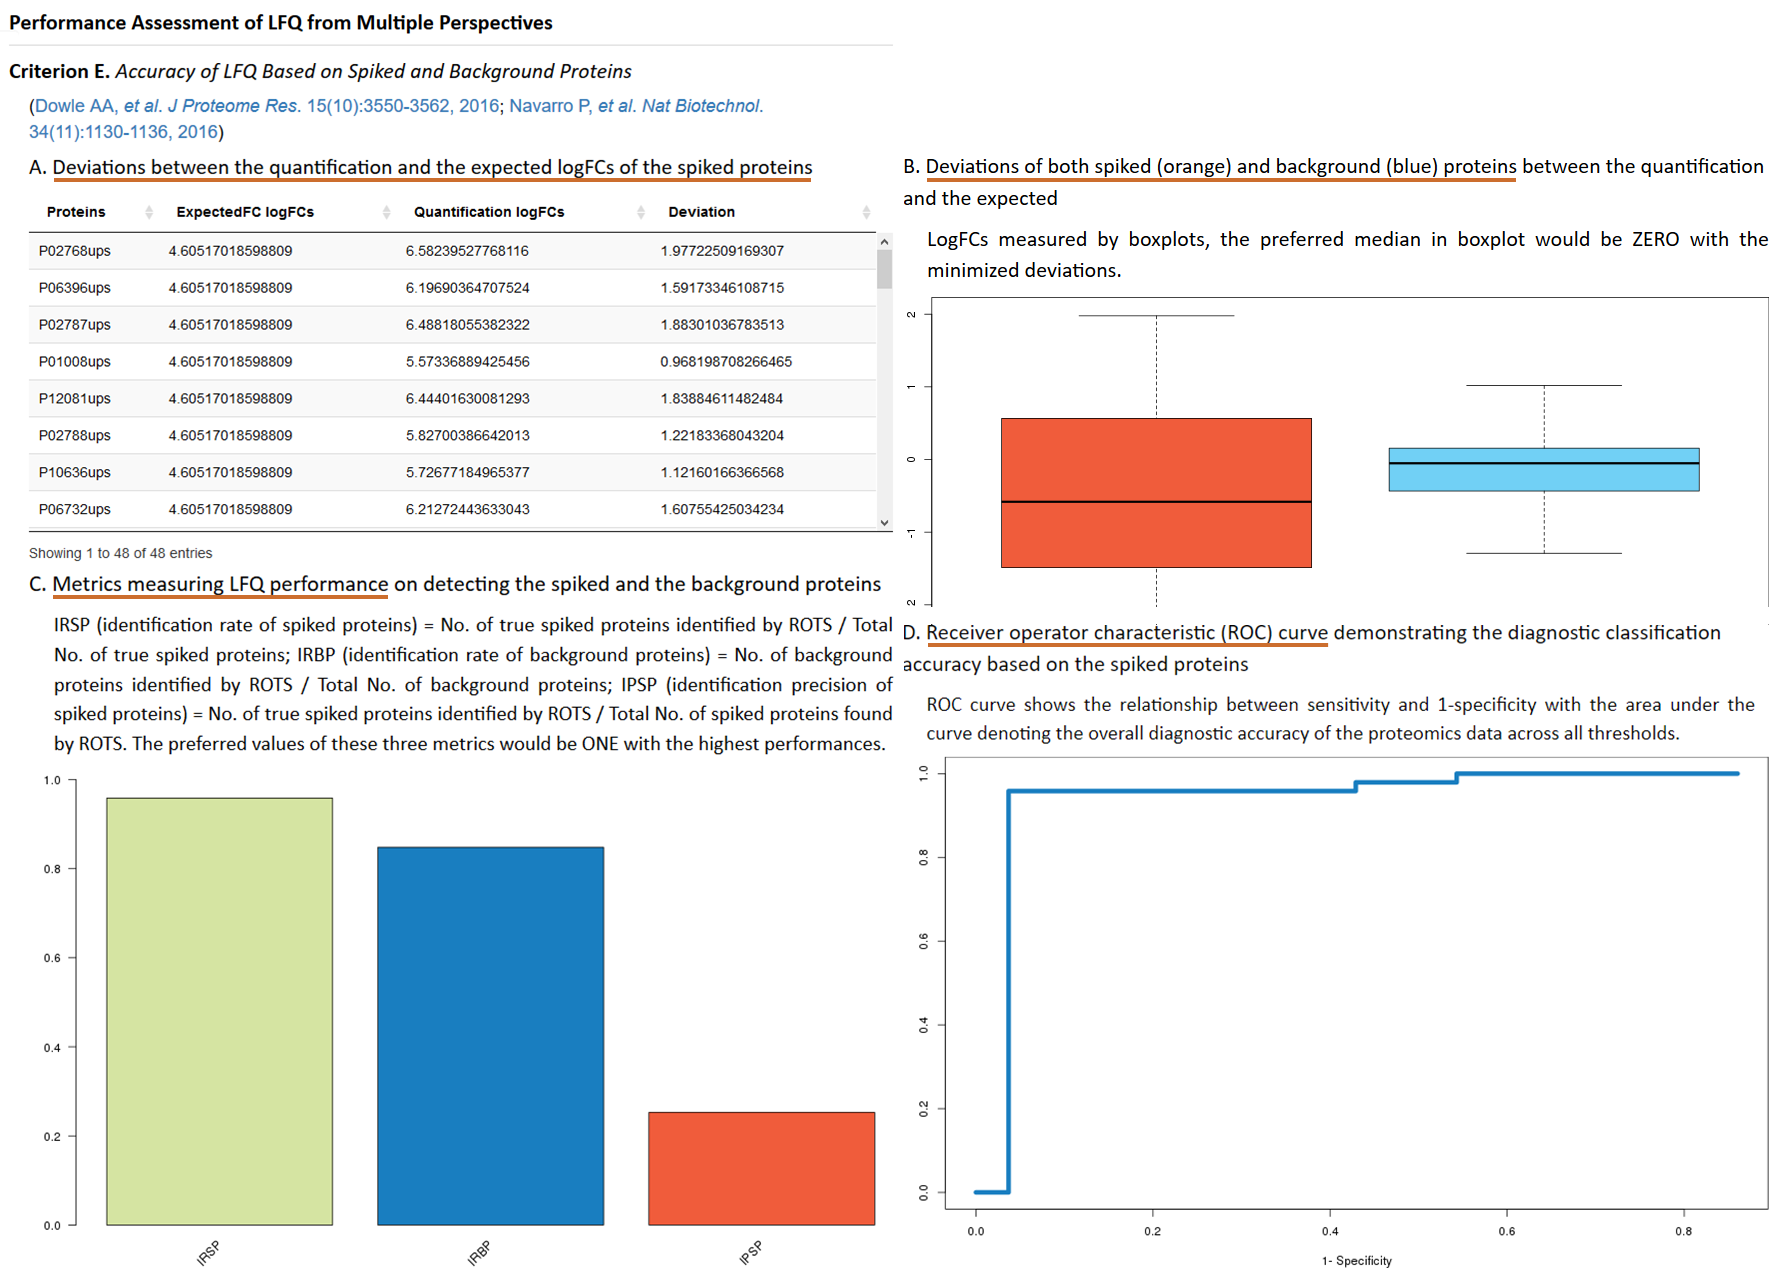
Additional experimental data (e.g. spiked proteins) are frequently generated and used as references to validate or adjust the performance of LFQ (Kuharev J, et al. Proteomics. 15(18):3140-3151, 2015; Navarro P, et al. Nat Biotechnol. 34(11):1130-1136, 2016), and the expected log fold changes (logFCs) are known both for the spiked and the background proteins (the expected LogFC for background proteins equals to zero) (Välikangas T, et al. Brief Bioinform. doi:10.1093/bib/bbx054, 2017). In ANPELA, the reproducibility-optimized test statistic (ROTS) is firstly applied to identify the differentially expressed proteins. Then, the true positive rate (TPR), the true negative rate (TNR) and the precision (PRE) for the success discovery of the spiked proteins are calculated. The higher the TPR, the more accurate the LFQ achieves. Moreover, the logFCs of protein intensities (for both spiked and background proteins) between two sample groups are calculated, and the level of correspondence between the quantification and the expected logFCs is then assessed by the mean squared error (MSE). The performance of LFQ can be reflected by how well the quantification logFCs corresponded to what are expected based on the references (Välikangas T, et al. Brief Bioinform. doi:10.1093/bib/bbx054, 2017). Moreover, a boxplot illustrating the deviations of both quantification and expected logFCs of the spiked proteins is provided. The preferred median in boxplot would be zero with minimized deviations. The required format of the file providing the information of the spiked proteins can be readily downloaded HERE ( Right Click to Save). The users will be asked to upload this file in the “Performance Assessment” step, and multiple metrics under this criterion will be calculated to the users for evaluating their selected quantification workflow. Moreover, the sample outputs of "Deviations between the quantification and the expected LogFCs of the spiked proteins", "Deviations of both spiked and background proteins between the quantification and the expected", "Metrics measuring LFQ performance" and "ROC curve of classification accuracy" that perform interactively in the same way as real output are provided.
ANPELA accepts a variety of data generated by 18 kinds of popular quantification software, all of which aim at pre-processing the raw proteomics data acquired by 3 quantification measurements:
2.1 A List of Software for Pre-processing the Data Acquired Based on SWATH-MS
(software sorted alphabetically)

2.2 A List of Software for Pre-processing the Data Acquired Based on Precursor Ion Signal Intensity (Peak Intensity)
(software sorted alphabetically)

2.3 A List of Software for Pre-processing the Data Acquired Based on Spectral Counting
(software sorted alphabetically)

Users are provided with the option to conduct transformation, pretreatment and imputation on their uploaded data. In total, 3 transformation, 18 pretreatment and 7 imputation methods frequently applied to manipulate the label-free proteomics data are provided in the current version of ANPELA.
3.1 Methods for Data Transformation
(methods sorted alphabetically)
![]()
3.2 Methods for Data Pretreatment
Pretreatment Methods include 2 centering methods, 4 scaling methods and 12 normalization methods.

3.3 Methods for Missing Value Imputation
(methods sorted alphabetically)

4. Diverse MS Systems for Proteome Quantification
Those popular kinds of software listed in the Section 2 of this Manual aim at quantifying the raw proteomics data derived from a diverse set of MS systems including the AB SCIEX Q-TOF systems, the Agilent Q-TOF mass spectrometer, the Bruker hybrid Q-TOF mass spectrometer and the Thermo Fisher Scientific Orbitrap.

4.1 AB SCIEX Q-TOF Systems
4000 System, API 3200 System)
4.2 Agilent Q-TOF
4.3 Bruker Hybrid Q-TOF Mass Spectrometer
4.4 Thermo Fisher Scientific Orbitrap
Al Shweiki MR, et al. Assessment of Label-Free Quantification in Discovery Proteomics and Impact of Technological Factors and Natural Variability of Protein Abundance. J Proteome Res. 16(4):1410-1424, 2017
Almeida AM, et al. The longissimus thoracis muscle proteome in Alentejana bulls as affected by growth path. J Proteomics. 152:206-215, 2017
Alter O, et al. Singular value decomposition for genome-wide expression data processing and modeling. PNAS. 97(18):10101-10106, 2000
Andjelkovic V, et al. Changes in gene expression in maize kernel in response to water and salt stress. Plant Cell Rep. 25(1):71-99, 2006
Anjo SI, et al. SWATH-MS as a tool for biomarker discovery: From basic research to clinical applications. Proteomics. 17(3-4), 2017
Ballman KV, et al. Faster cyclic loess: normalizing RNA arrays via linear models. Bioinformatics. 20(16):2778-86, 2004
Blaise BJ. Data-driven sample size determination for metabolic phenotyping studies. Anal Chem. 85(19):8943-8950, 2013
Bolstad BM, et al. A comparison of normalization methods for high density oligonucleotide array data based on variance and bias. Bioinformatics. 19(2):185-93, 2003
Borgaonkar SP, et al. Comparison of normalization methods for the identification of biomarkers using MALDI-TOF and SELDI-TOF mass spectra. OMICS. 14(1):115-26, 2010
Bouyssié D, et al. Mascot file parsing and quantification (MFPaQ), a new software to parse, validate, and quantify proteomics data generated by ICAT and SILAC mass spectrometric analyses: application to the proteomics study of membrane proteins from primary human endothelial cells. Mol Cell Proteomics. 6(9):1621-1637, 2007
Broudy D, et al. A framework for installable external tools in Skyline. Bioinformatics. 30(17):2521-2523, 2014
Bruderer R, et al. Extending the limits of quantitative proteome profiling with data-independent acquisition and application to acetaminophen-treated three-dimensional liver microtissues. Mol Cell Proteomics. 14(5):1400-1410, 2015
Bruderer R, et al. High-precision iRT prediction in the targeted analysis of data-independent acquisition and its impact on identification and quantitation. Proteomics. 16(15-16):2246-2256, 2016
Callister SJ, et al. Normalization approaches for removing systematic biases associated with mass spectrometry and label-free proteomics. J Proteome Res. 5(2):277-86, 2006
Cao MQ, et al. Identification of salivary biomarkers in breast cancer patients with thick white or thick yellow tongue fur using isobaric tags for relative and absolute quantitative proteomics. Zhong Xi Yi Jie He Xue Bao. 9(3):275-280, 2011
Casado-Vela J, et al. iTRAQ-based quantitative analysis of protein mixtures with large fold change and dynamic range. Proteomics. 10(2):343-347, 2010
Chai LE, et al. Investigating the effects of imputation methods for modelling gene networks using a dynamic bayesian network from gene expression data. Malays J Med Sci. 21(2):20-22, 2014
Chawade A, et al. Normalyzer: a tool for rapid evaluation of normalization methods for omics data sets. J Proteome Res. 13(6):3114-3120, 2014
Cheadle C, et al. Analysis of microarray data using Z score transformation. J Mol Diagn. 5(2):73-81, 2003
Chen YY, et al. Refining comparative proteomics by spectral counting to account for shared peptides and multiple search engines. Anal Bioanal Chem. 404(4):1115-1125, 2012
Cho CK, et al. Proteomics analysis of human amniotic fluid. Mol Cell Proteomics. 6(8):1406-15, 2007
Cociorva D, et al. Validation of tandem mass spectrometry database search results using DTASelect. Curr Protoc Bioinformatics. Chapter 13:Unit 13.4, 2007
Codrea MC, et al. Platforms and Pipelines for Proteomics Data Analysis and Management. Adv Exp Med Biol. 919:203-215, 2016
Colaert N, et al. Thermo-msf-parser: an open source Java library to parse and visualize Thermo Proteome Discoverer msf files. J Proteome Res. 10(8):3840-3843, 2011
Cox J, et al. MaxQuant enables high peptide identification rates, individualized p.p.b.-range mass accuracies and proteome-wide protein quantification. Nat Biotechnol. 26(12):1367-1372, 2008
De Livera AM, et al. Normalizing and integrating metabolomics data. Anal Chem. 84(24):10768-10776, 2012
Dieterle F, et al. Probabilistic quotient normalization as robust method to account for dilution of complex biological mixtures. Application in 1H NMR metabonomics. Anal Chem. 78(13):4281-4290, 2006
Dike AO. The Distribution of Cube Root Transformation of the Error Component of the Multiplicative Time Series Model. Global Journal Inc. 16(5):49-60, 2016
Dorts J, et al. Effects of cadmium exposure on the gill proteome of Cottus gobio: modulatory effects of prior thermal acclimation. Aquat Toxicol. 154:87-96, 2014
Dupierris V, et al. A toolbox for validation of mass spectrometry peptides identification and generation of database: IRMa. Bioinformatics. 25(15):1980-1981, 2009
Ejigu BA, et al. Evaluation of normalization methods to pave the way towards large-scale LC-MS-based metabolomics profiling experiments. OMICS. 17(9):473-485, 2013
Escher C, et al. Using iRT, a normalized retention time for more targeted measurement of peptides. Proteomics. 12(8):1111-1121, 2012
Fermin D, et al. Abacus: A computational tool for extracting and pre-processing spectral count data for label-free quantitative proteomic analysis. Proteomics. 11(7):1340-1345, 2011
Gan X, et al. Microarray missing data imputation based on a set theoretic framework and biological knowledge. Nucleic Acids Res. 34(5):1608-1619, 2006
Gao Y, et al. Evaluation of sample extraction methods for proteomics analysis of green algae Chlorella vulgaris. Electrophoresis. 37(10):1270-1276, 2016
Garbis SD, et al. A novel multidimensional protein identification technology approach combining protein size exclusion prefractionation, peptide zwitterion-ion hydrophilic interaction chromatography, and nano-ultraperformance RP chromatography/nESI-MS2 for the in-depth analysis of the serum proteome and phosphoproteome: application to clinical sera derived from humans with benign prostate hyperplasia. Anal Chem. 83(3):708-18, 2011
Gaspari M, et al. Proteome Speciation by Mass Spectrometry: Characterization of Composite Protein Mixtures in Milk Replacers. Anal Chem. 88(23):11568-11574, 2016
Gautier V, et al. Label-free quantification and shotgun analysis of complex proteomes by one-dimensional SDS-PAGE/NanoLC-MS: evaluation for the large scale analysis of inflammatory human endothelial cells. Mol Cell Proteomics. 11(8):527-539. 2012
Griffin NM, et al. Label-free, normalized quantification of complex mass spectrometry data for proteomic analysis. Nat Biotechnol. 28(1):83-89, 2010
Gromski PS, et al. The influence of scaling metabolomics data on model classification accuracy. Metabolomics. 11:684-695, 2015
Guo T, et al. Rapid mass spectrometric conversion of tissue biopsy samples into permanent quantitative digital proteome maps. Nat Med. 21(4):407-413, 2015
Gärdén P, et al. PROTEIOS: an open source proteomics initiative. Bioinformatics. 21(9):2085-2087, 2005
Hoedt E, et al. SILAC-based proteomic profiling of the human MDA-MB-231 metastatic breast cancer cell line in response to the two antitumoral lactoferrin isoforms: the secreted lactoferrin and the intracellular delta-lactoferrin. PLoS One. 9(8):e104563, 2014
Hoekman B, et al. msCompare: a framework for quantitative analysis of label-free LC-MS data for comparative candidate biomarker studies. Mol Cell Proteomics. 11(6):M111, 2012
Hong MG, et al. Multidimensional Normalization to Minimize Plate Effects of Suspension Bead Array Data. J Proteome Res. 15(10):3473-3480, 2016
Huber W, et al. Variance stabilization applied to microarray data calibration and to the quantification of differential expression. Bioinformatics. 18 Suppl 1:S96-104, 2002
Häkkinen J, et al. The proteios software environment: an extensible multiuser platform for management and analysis of proteomics data. J Proteome Res. 8(6):3037-3043, 2009
Karpievitch YV, et al. Liquid Chromatography Mass Spectrometry-Based Proteomics: Biological and Technological Aspects. Ann Appl Stat. 4(4):1797-1823,2010
Karpievitch YV, et al. Metabolomics data normalization with EigenMS. PLoS One. 9(12):e116221, 2014
Karpievitch YV, et al. Normalization and missing value imputation for label-free LC-MS analysis. BMC Bioinformatics. 13(S16):S5, 2012
Keeping AJ, et al. Data variance and statistical significance in 2D-gel electrophoresis and DIGE experiments: comparison of the effects of normalization methods. J Proteome Res. 10(3):1353-60, 2011
Keller A, et al. Empirical statistical model to estimate the accuracy of peptide identifications made by MS/MS and database search. Anal Chem. 74(20):5383-5392, 2002
Khoonsari PE, et al. Analysis of the Cerebrospinal Fluid Proteome in Alzheimer's Disease. PLoS One. 11(3):e0150672, 2016
Kim H, et al. Missing value estimation for DNA microarray gene expression data: local least squares imputation. Bioinformatics. 21(2):1-12, 2004
Kohl SM, et al. State-of-the art data normalization methods improve NMR-based metabolomic analysis. Metabolomics. 8(Suppl 1):146-160, 2012
MacLean B, et al. Skyline: an open source document editor for creating and analyzing targeted proteomics experiments Bioinformatics. 26(7):966-968, 2010
Matzke MM, et al. Improved quality control processing of peptide-centric LC-MS proteomics data. Bioinformatics. 27(20):2866-2872, 2011
McManus FP, et al. Identification of cross talk between SUMOylation and ubiquitylation using a sequential peptide immunopurification approach. Nat Protoc. 12(11):2342-2358, 2017
Millikin RJ, et al. Ultrafast Peptide Label-Free Quantification with FlashLFQ. J Proteome Res, 2017
Mouton-Barbosa E, et al. In-depth exploration of cerebrospinal fluid by combining peptide ligand library treatment and label-free protein quantification. Mol Cell Proteomics. 9(5):1006-1021, 2010
Navarro P, et al. A multicenter study benchmarks software tools for label-free proteome quantification. Nat Biotechnol. 34(11):1130-1136, 2016
Nesvizhskii AI, et al. A statistical model for identifying proteins by tandem mass spectrometry. Anal Chem. 75(17):4646-58, 2003
Neuhauser N, et al. Expert system for computer-assisted annotation of MS/MS spectra. Mol. Cell. Proteomics. 11(11):1500-1509, 2012
Nezami Ranjbar MR, et al. Gaussian process regression model for normalization of LC-MS data using scan-level information. Proteome Sci. 11(Suppl 1):S13, 2013
Padoan A, et al. Reproducibility in urine peptidome profiling using MALDI-TOF. Proteomics. 15(9):1476-1485, 2015
Park GW, et al. Integrated Proteomic Pipeline Using Multiple Search Engines for a Proteogenomic Study with a Controlled Protein False Discovery Rate. J Proteome Res. 15(11):4082-4090, 2016
Park SK, et al. A quantitative analysis software tool for mass spectrometry-based proteomics. Nat Methods. 5(4):319-322, 2008
Park SK, et al. Census for proteome quantification. Curr Protoc Bioinformatics. Chapter 13:Unit 13.12.1-11, 2010
Prieto JH, et al. Large-scale differential proteome analysis in Plasmodium falciparum under drug treatment. PLoS One. 3(12):e4098, 2008
Pursiheimo A, et al. Optimization of Statistical Methods Impact on Quantitative Proteomics Data. J Proteome Res. 14(10):4118-4126, 2015
Ramus C, et al. Benchmarking quantitative label-free LC-MS data processing workflows using a complex spiked proteomic standard dataset. J Proteomics. 132:51-62, 2016
Ramus C, et al. Spiked proteomic standard dataset for testing label-free quantitative software and statistical methods. Data Brief. 6:286-294, 2015
Reindl J, et al. Proteomic biomarkers for psoriasis and psoriasis arthritis. J Proteomics. 140:55-61, 2016
Risso D, et al. Normalization of RNA-seq data using factor analysis of control genes or samples. Nat Biotechnol. 32(9):896-902, 2014
Rosenberger G, et al. Inference and quantification of peptidoforms in large sample cohorts by SWATH-MS. Nat Biotechnol 35(8):781-788, 2017
Rosenberger G, et al. Statistical control of peptide and protein error rates in large-scale targeted data-independent acquisition analyses. Nat Methods 14(9):921-927, 2017
Röst HL, et al. OpenMS: a flexible open-source software platform for mass spectrometry data analysis. Nat Methods. 13(9):741-748, 2016
Röst HL, et al. OpenSWATH enables automated, targeted analysis of data-independent acquisition MS data. Nat Biotechnol. 32(3):219-223, 2014
Röst HL, et al. TRIC: an automated alignment strategy for reproducible protein quantification in targeted proteomics. Nat Methods. 13(9):777-783. 2016
Sakia RM. The Box-Cox transformation technique: a review. The Statistician. 41:169-178, 1992
Saranya C, et al. A Study on Normalization Techniques for Privacy Preserving Data Mining. International Journal of Engineering and Technology. 5(3):2701-2704, 2013
Saraswat M, et al. Comparative proteomic profiling of the serum differentiates pancreatic cancer from chronic pancreatitis. Cancer Med. 6(7):1738-1751, 2017
Savas JN, et al. Proteomic Analysis of Protein Turnover by Metabolic Whole Rodent Pulse-Chase Isotopic Labeling and Shotgun Mass Spectrometry Analysis Methods Mol Biol. 1410:293-304, 2016
Schilling B, et al. Platform-independent and label-free quantitation of proteomic data using MS1 extracted ion chromatograms in skyline: application to protein acetylation and phosphorylation. Mol Cell Proteomics. 11(5):202-214, 2012
Schlaffner CN, et al. Fast, Quantitative and Variant Enabled Mapping of Peptides to Genomes. Cell Syst. 5(2):152-156, 2017
Searle BC. Scaffold: a bioinformatic tool for validating MS/MS-based proteomic studies. Proteomics. 10(6):1265-9, 2016
Shao S, et al. Minimal sample requirement for highly multiplexed protein quantification in cell lines and tissues by PCT-SWATH mass spectrometry Proteomics. 15(21):3711-3721, 2015
Sturm M, et al. OpenMS - an open-source software framework for mass spectrometry. BMC Bioinformatics. 9:163, 2008
Tabb DL, et al. DTASelect and Contrast: tools for assembling and comparing protein identifications from shotgun proteomics. J Proteome Res. 1(1):21-6, 2002
Tsou CC, et al. DIA-Umpire: comprehensive computational framework for data-independent acquisition proteomics. Nat Methods. 12(3):258-264, 2015
Tsou CC, et al. Untargeted, spectral library-free analysis of data-independent acquisition proteomics data generated using Orbitrap mass spectrometers. Proteomics. 16(15-16):2257-2271, 2016
Twigt JM, et al. Preconception folic acid use influences the follicle fluid proteome. Eur J Clin Invest. 45(8):833-41, 2015
Tyanova S, et al. The MaxQuant computational platform for mass spectrometry-based shotgun proteomics. Nat Protoc. 11(12):2301-2319, 2016
Tyanova S, et al. Visualization of LC-MS/MS proteomics data in MaxQuant. Proteomics. 15(8):1453-1456, 2015
Van den Berg RA, et al. Centering, scaling, and transformations: improving the biological information content of metabolomics data. BMC Genomics. 7:142, 2006
Veit J, et al. LFQProfiler and RNP(xl): Open-Source Tools for Label-Free Quantification and Protein-RNA Cross-Linking Integrated into Proteome Discoverer. J Proteome Res. 15(9):3441-3448, 2016
Vidotto A, et al. Systems Biology Reveals NS4B-Cyclophilin A Interaction: A New Target to Inhibit YFV Replication. J Proteome Res. 16(4):1542-1555, 2017
Välikangas T, et al. A comprehensive evaluation of popular proteomics software workflows for label-free proteome quantification and imputation. Brief Bioinform. doi:10.1093/bib/bbx054, 2017
Välikangas T, et al. A systematic evaluation of normalization methods in quantitative label-free proteomics. Brief Bioinform. pii: bbw095, 2016
Végvári A, et al. Bioinformatic strategies for unambiguous identification of prostate specific antigen in clinical samples Mol Cell J Proteomics. 75(1):202-210, 2011
Wan J, et al. Palmitoylated proteins: purification and identification. Nat Protoc. 2(7):1573-1584, 2007
Wang F, et al. Label free quantitative proteomics analysis on the cisplatin resistance in ovarian cancer cells. Cell Mol Biol (Noisy-le-grand). 63(5):25-28, 2017
Wang X, et al. Optimal consistency in microRNA expression analysis using reference-gene-based normalization. Mol Biosyst. 11(5):1235-1240, 2015
Webb-Robertson BJ, et al. A Statistical Analysis of the Effects of Urease Pre-treatment on the Measurement of the Urinary Metabolome by Gas Chromatography-Mass Spectrometry. Metabolomics. 10(5):897-908, 2014
Webb-Robertson BJ, et al. A Statistical Selection Strategy for Normalization Procedures in LC-MS Proteomics Experiments through Dataset Dependent Ranking of Normalization Scaling Factors. Proteomics. 11(24):4736-4741, 2011
Weisser H, et al. An automated pipeline for high-throughput label-free quantitative proteomics. J Proteome Res. 12(4):1628-1644, 2013
Wu JX, et al. SWATH Mass Spectrometry Performance Using Extended Peptide MS/MS Assay Libraries. Mol Cell Proteomics. 15(7):2501-2514, 2016
Wu L, et al. A hybrid retention time alignment algorithm for SWATH-MS data. Proteomics. 16(15-16):2272-2283, 2016
Yan W, et al. A dataset of human liver proteins identified by protein profiling via isotope-coded affinity tag (ICAT) and tandem mass spectrometry. Mol Cell Proteomics. 3(10):1039-1041, 2004
Yang YH, et al. Normalization for cDNA Microarray Data. Proc Spie. 6(10):1-21, 2003
Zhang J, et al. An intelligentized strategy for endogenous small molecules characterization and quality evaluation of earthworm from two geographic origins by ultra-high performance HILIC/QTOF MS(E) and Progenesis QI. Anal Bioanal Chem. 408(14):3881-3890, 2016
Zhang J, et al. PEAKS DB: De Novo Sequencing Assisted Database Search for Sensitive and Accurate Peptide Identification. Mol Cell Proteomics. 11(4):M111, 2012
Zhang Y, et al. The Use of Variable Q1 Isolation Windows Improves Selectivity in LC-SWATH-MS Acquisition. J Proteome Res. 14(10):4359-4371, 2015
Zhang Z. Recombinant human activated protein C for the treatment of severe sepsis and septic shock: a study protocol for incorporating observational evidence using a Bayesian approach. BMJ Open. 4(7):e005622, 2014
![]() @ ZJU
@ ZJU
Please feel free to visit our website at https://idrblab.org

Dr. Jing Tang (tangj@cqu.edu.cn)
Dr. Jianbo Fu (fujianbo@zju.edu.cn)
Dr. Yunxia Wang (lfwyx@zju.edu.cn)
Prof. Feng Zhu* (zhufeng@zju.edu.cn)


Address
College of Pharmaceutical Sciences,
Zhejiang University,
Hangzhou, China
Postal Code: 310058

Phone/Fax