NOREVA provides an online service enabling performance evaluation of various normalization methods from multiple perspectives. In particular, it integrates 5 well-established criteria, each with a distinct underlying theory, to ensure a more comprehensive evaluation than any single criterion. Moreover, it provides various available and popular normalization methods, with a unique feature of allowing quality control based correction sequentially followed by data normalization. Welcome to visit the homepage of our lab IDRB at https://idrblab.org/
Citing NOREVA: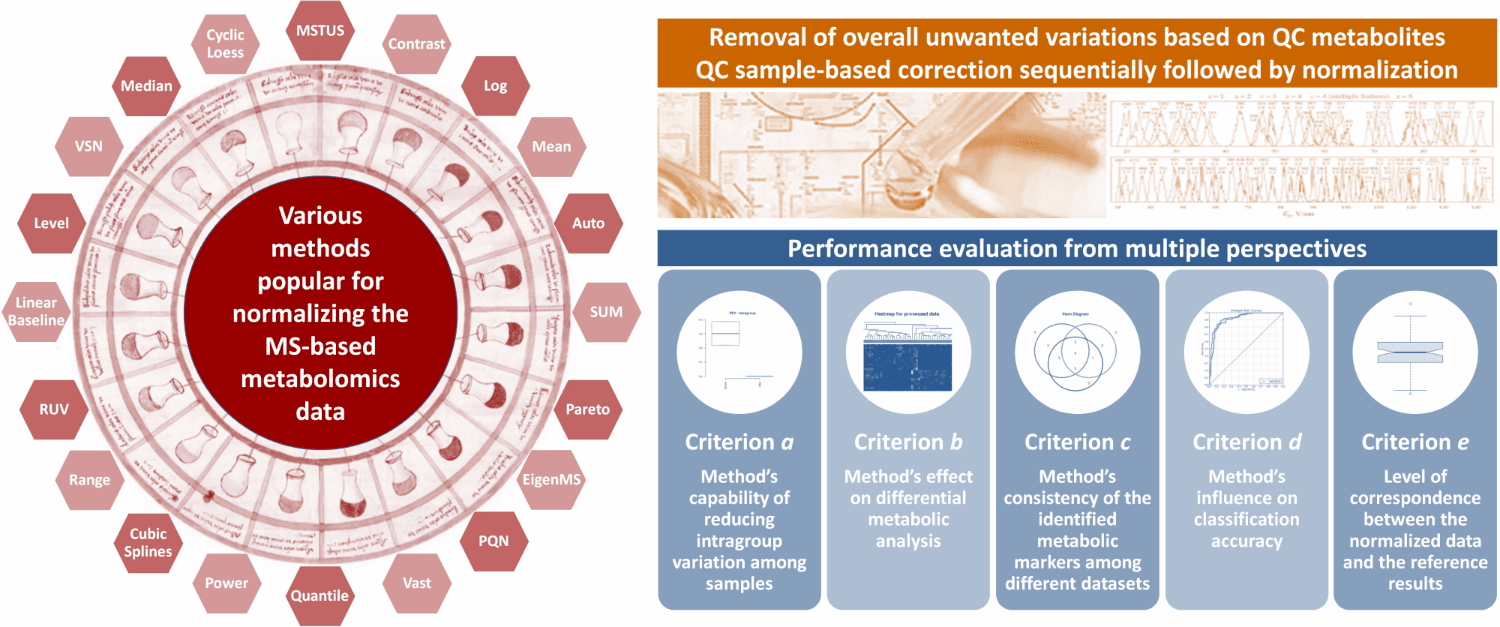
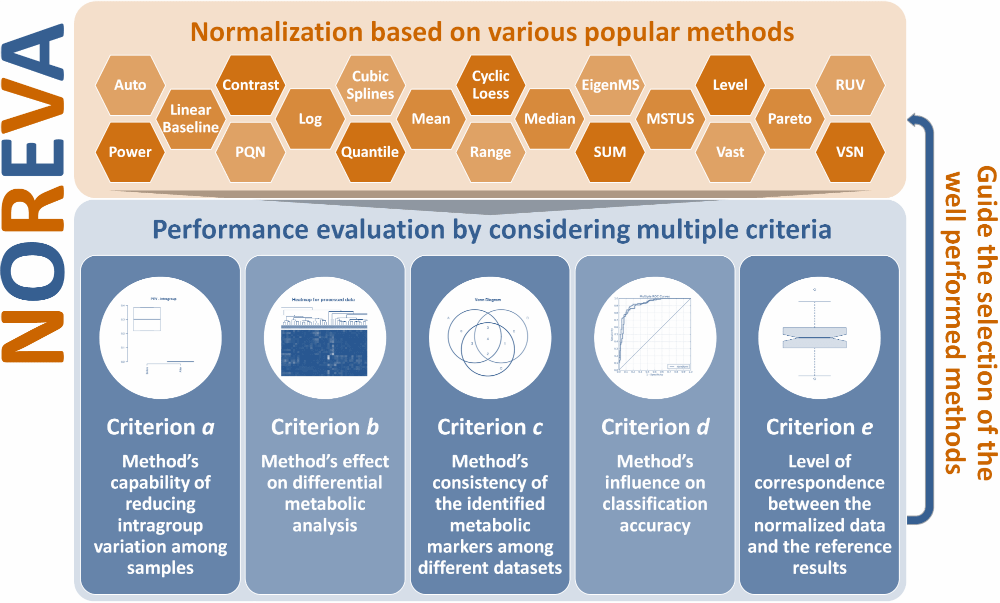
Currently, 24 normalization methods popular for MS-based metabolomics data normalization are provided in NOREVA, which include (1) Auto Scaling, (2) CCMN, (3) Contrast, (4) Cubic Splines, (5) Cyclic Loess, (6) EigenMS, (7) Level Scaling, (8) Linear Baseline Scaling, (9) Log-transform, (10) Mean Normalization, (11) Median Normalization, (12) MSTUS, (13) NOMIS, (14) Pareto Scaling, (15) Power Scaling, (16) PQN, (17) Quantile, (18) Range Scaling, (19) RUV-2, (20) RUV-random, (21) SIS, (22) Total Sum, (23) Vast Scaling and (24) VSN. If there is some other methods you prefer NOREVA to include, please directly inform us at libcell@cqu.edu.cn (Dr. Bo Li). Thanks for using and improving the NOREVA.
Moreover, 5 well-established criteria available for assessing the normalization performance are provided. (a) Method’s capability of reducing intragroup variation among samples; (b) Method’s effect on differential metabolic analysis; (c) Method’s consistency of the identified metabolic markers among different datasets; (d) Method’s influence on classification accuracy; (e) Level of correspondence between normalized and reference data. Each criterion makes the performance assessment possible from its own perspective, and the combination of multiple criteria can therefore provide a much more comprehensive evaluation to the studied method than any single one. Evaluation results of all these criteria and measures are directly displayed on the web page, and can be fully downloaded from the website as a separate report.
The service provided here is powered by R shiny, and is free and open to all users with no login requirement. NOREVA can be readily accessed by all popular web browsers including Google Chrome, Mozilla Firefox, Safari and Internet Explorer 10 (or later), and so on. Once it is available, we would really appreciate if you can submit bug reports and feature requests to Dr. Bo Li at libcell@cqu.edu.cn.
College of Pharmaceutical Sciences, Zhejiang University
Hangzhou, P.R. China, 310058.
Contact number: +86-(0)571-8820-8444
Example dataset are provided here for downloading and testing
Dataset-A (dataset with QC samples, MTBLS79 from the MetaboLights)
Dataset-B (dataset without QC samples, MTBLS59 from the MetaboLights)
Dataset-BG (golden standards for Dataset-B)
Dataset-C (dataset with internal standards, metabolomics dataset from Redestig, H. et al. work.)
QC-based Correction and Data Imputation
QC correction is running! It takes 10-20 seconds...
please input the serial number of metabolic feature into the box above, and the corresponding name of the selected metabolic feature is:
Missing Value Imputation
Preprocessing is running! It takes about 10 seconds...
Missing Value Imputation
Preprocessing is running! It takes about 10 seconds...
Data Normalization
Normalizing......
In general, a few minutes are needed in this procedure, please wait for a moment.
Data Normalization
Normalizing......
In general, a few minutes are needed in this procedure, please wait for a moment.
Data Normalization
Normalizing......
In general, a few minutes are needed in this procedure, please wait for a moment.
Performance Evaluation from Multiple Perspectives
Evaluating......
In general, a few minutes are needed in this procedure, please wait for a moment.
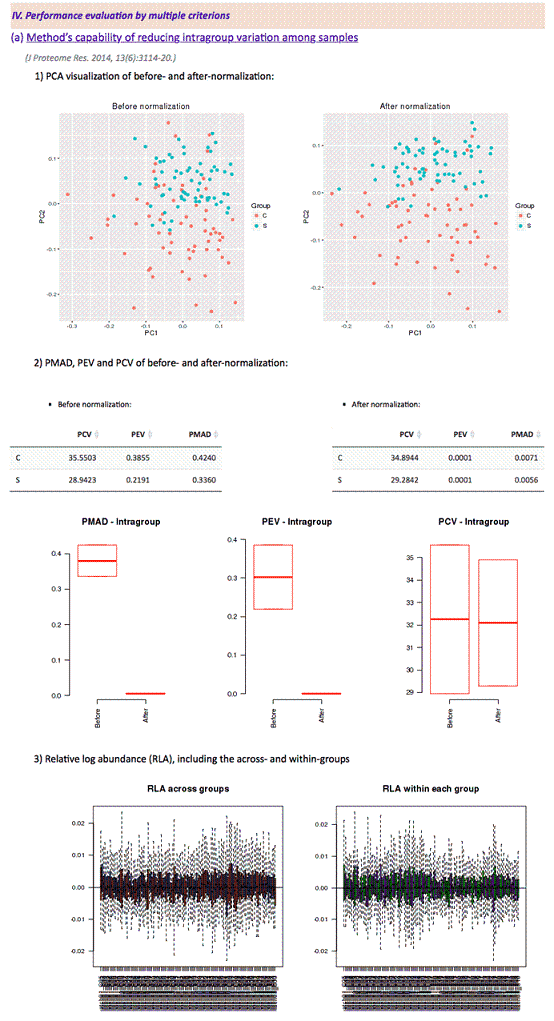
(J Proteome Res. 2014, 13(6):3114-20.)
1) visualization of PCA results before and after normalization
2) the values of PMAD, PEV and PCV before and after normalization
Before normalization
After normalization
3) the results of relative log abundance (RLA)
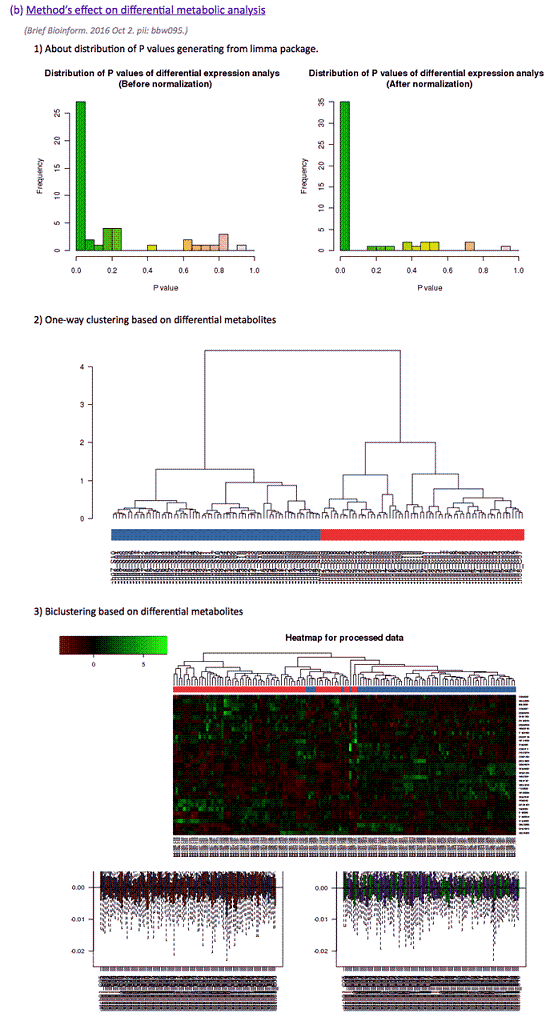
(b) Method’s effect on differential metabolic analysis
(Brief Bioinform. 2016 Oct 2. pii: bbw095.)
1) distribution of P-values
2) one-way clustering results based on differential metabolic features (with manhattan distance and ward agglomeration method)
3) biclustering results based on differential metabolic features (with euclidean distance and complete agglomeration method)
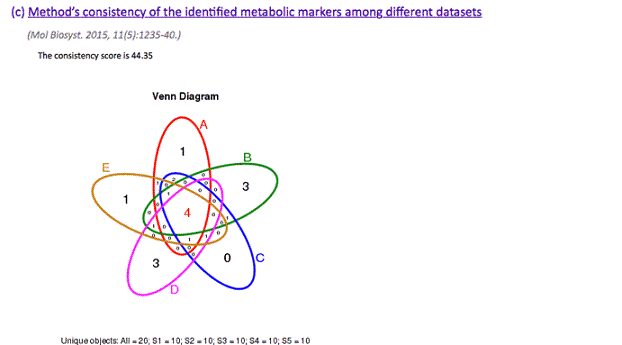
(c) Method’s consistency of the identified metabolic markers among different datasets
(Mol Biosyst. 2015, 11(5):1235-40.)
(Anal Chem. 2012, 84(24):10768-76; Nat Biotechnol. 2014, 32(9):896-902; Metabolomics. 2015, 11:684-695.)

(Brief Bioinform. 2016 Oct 2. pii: bbw095.)
Differences between metabolomics data and reference data estimates of sample A/sample B log-fold-changes are shown in following table.
For this dataset, difference between metabolomics data and true marker estimates of sample A/sample B log-fold-changes, that is, bias in metabolomics data when viewing true markers as the gold standard.
Performance Evaluation from Multiple Perspectives
Evaluating......
In general, a few minutes are needed in this procedure, please wait for a moment.
(J Proteome Res. 2014, 13(6):3114-20.)
1) visualization of PCA results before and after normalization
2) the values of PMAD, PEV and PCV before and after normalization
Before normalization
After normalization
3) the results of relative log abundance (RLA)
(b) Method’s effect on differential metabolic analysis
(Brief Bioinform. 2016 Oct 2. pii: bbw095.)
1) distribution of P-values
2) one-way clustering results based on differential metabolic features (with manhattan distance and ward agglomeration method)
3) biclustering results based on differential metabolic features (with euclidean distance and complete agglomeration method)
(Mol Biosyst. 2015, 11(5):1235-40.)
(Anal Chem. 2012, 84(24):10768-76; Nat Biotechnol. 2014, 32(9):896-902; Metabolomics. 2015, 11:684-695.)
(Brief Bioinform. 2016 Oct 2. pii: bbw095.)
For this dataset, difference between metabolomics data and true marker estimates of sample A/sample B log-fold-changes, that is, bias in metabolomics data when viewing true markers as the gold standard.
Performance Evaluation from Multiple Perspectives
RUV-2 is not a global normalization method in the sense that it does not produce a complete normalized dataset, but rather a compressed set suitable for detecting differentially abundant metabolites. Hence, RUV-2 is not recommended in connection to classification, clustering problems or MMCA (Bioinformatics. 30(15):2155-61, 2014)
College of Pharmaceutical Sciences, Zhejiang University
Hangzhou, P.R. China, 310058.
Contact number: +86-(0)571-8820-8444
Overview of NOREVA and User Manual
1. Required Data Formats in the Input Files
2. Web-service and Operating Procedure of NOREVA
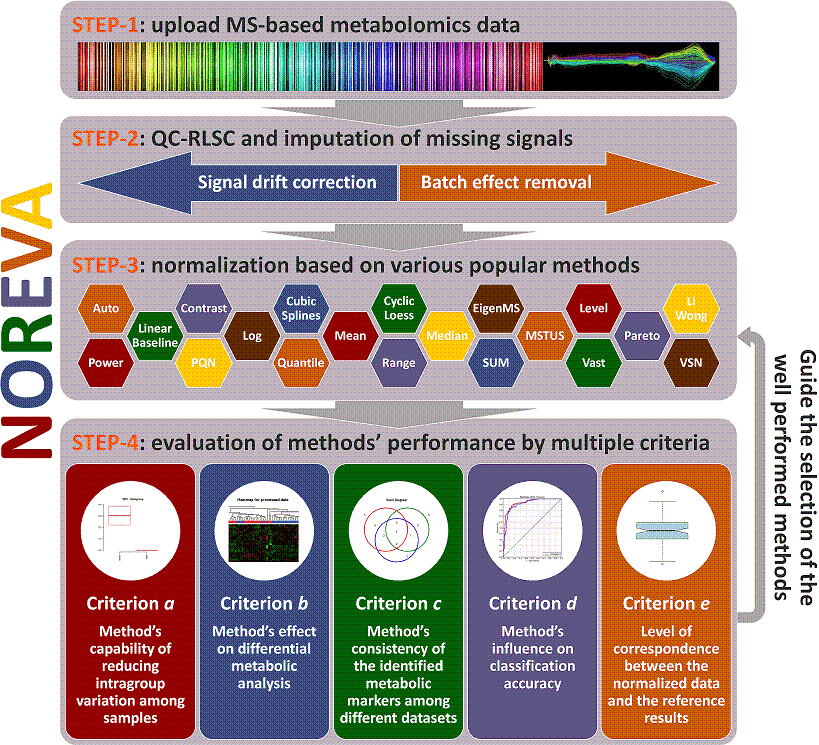
NOREVA is constructed for not only normalizing the mass spectrometry (MS)-based metabolomics data but also comparatively evaluating the suitability of different normalization methods from various perspectives. It offers 24 normalization methods and 5 different evaluation criteria for performance assessment. This website is free and open to all users and there is no login requirement, and can be readily accessed by all popular web browsers including Google Chrome, Mozilla Firefox, Safari and Internet Explorer 10 (or later), and so on. The analysis implemented here can be summarized into 4 steps: (STEP-1) uploading of metabolomics data, (STEP-2) data pre-processing, (STEP-3) data normalization and (STEP-4) performance evaluation. A report containing evaluation results is also generated and can be downloaded in the format of PDF, HTML and DOC. The flowchart below summarizes the flowchart of analyzing processes in NOREVA.
1. Required Data Formats in the Input Files (Back to top)
The file required at the beginning of NOREVA analysis should provide a sample-by-feature matrix in a csv format. The required input file in correct format could be readily generated based on results of several popular tools such as XCMS online.
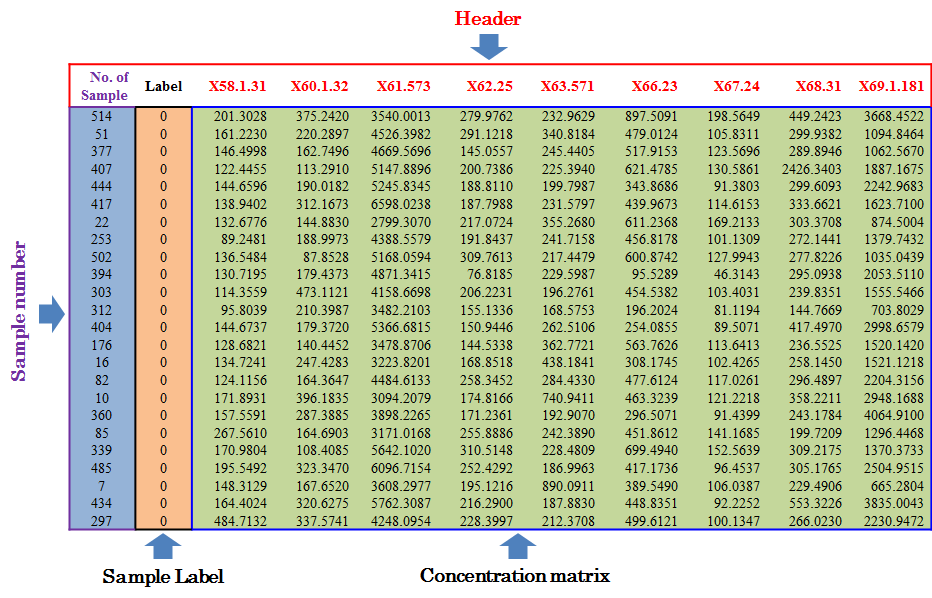
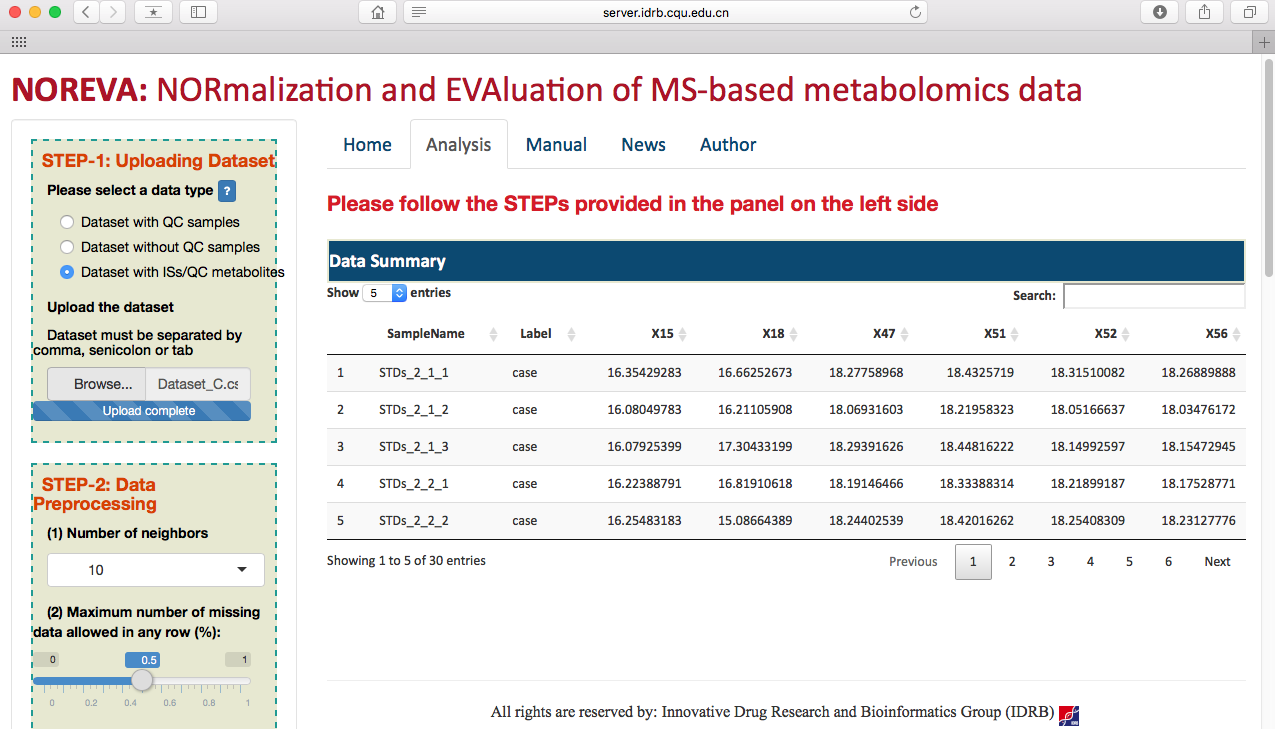
Input File for Analyzing Metabolomics Data with QC Samples
In this situation, the sample ID, batch ID, class of samples and injection order are sequentially provided in the first four columns of input file. Names of these columns must be kept as “sample”, “batch”, “class” and “order” without any changes during the entire analysis. The sample ID is uniquely assigned according to users’ preference; the batch ID refers to different analytical blocks or batches, and is labeled with ordinal number, e.g., 1,2,3,…; the class of samples indicates two sample groups and QC samples (the name of sample groups is different, and QC samples are all labeled as “NA”); the injection order is strictly follow the sequence of experiment. Importantly, the first row must be a QC sample, and the last row also must be a QC sample.
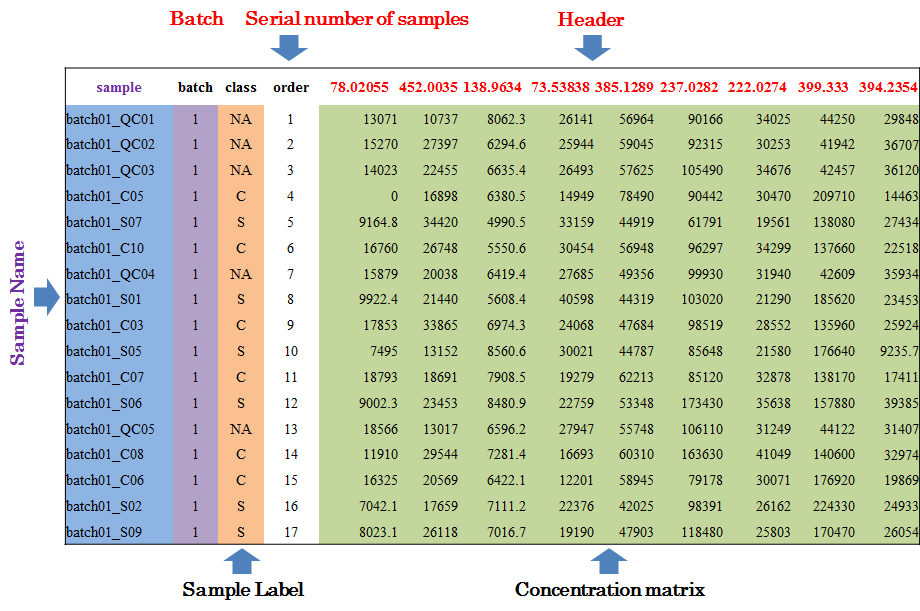
Input File for Analyzing Dataset without QC Samples or Experiments Ignoring QC Preparation
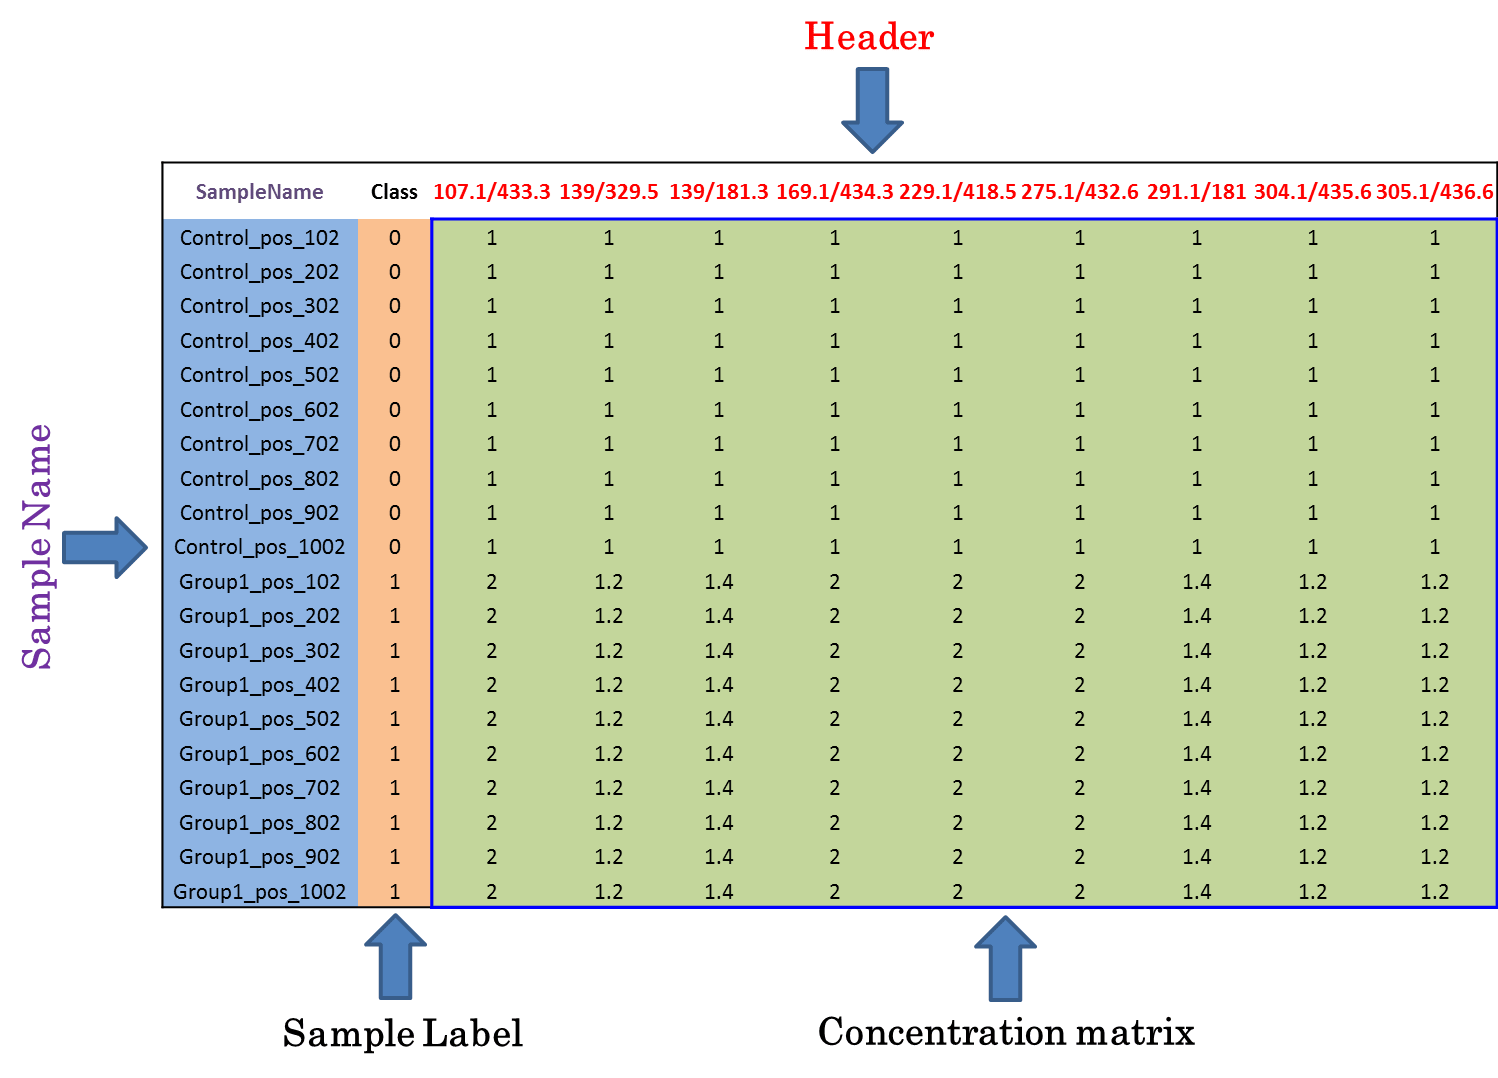
Under this circumstance, only sample ID and class of samples are required in the first 2 columns of the input file, and are kept as “SampleName” and “Label”. In the column of class of samples, “NA” is not labeled to any sample due to the absence of QC samples. In the following columns of both types of input file, metabolites’ raw intensities across all samples without logarithmic scaling are further provided. Unique IDs of each metabolite are listed in the first row of the csv file.
Input File Containing Reference Metabolites as Golden Standards
To evaluate methods based on the last criterion, additional file providing information of the reference metabolites (e.g., spike-in compounds) is needed for further analysis. In this file, sample ID and class of samples are required in the first 2 columns. Their names are provided as “sample” and “class”. The sample ID is also uniquely assigned according to users’ preference, and the class of samples indicates two sample groups of different name. Example file can also be downloaded from NOREVA.
Input File for Analyzing Dataset including the internal standards or QC metabolites
Under this circumstance, only sample name and class of samples are required in the first 2 columns of the input file, and are kept as “SampleName” and “Label”. In the column of class of samples, “NA” is not labeled to any sample due to the absence of QC samples. In the following columns of both types of input file, metabolites’ raw intensities across all samples without logarithmic scaling are further provided. Unique IDs of each metabolite are listed in the first row of the csv file.

2. Web-service and Operating Procedure of NOREVA (Back to top)
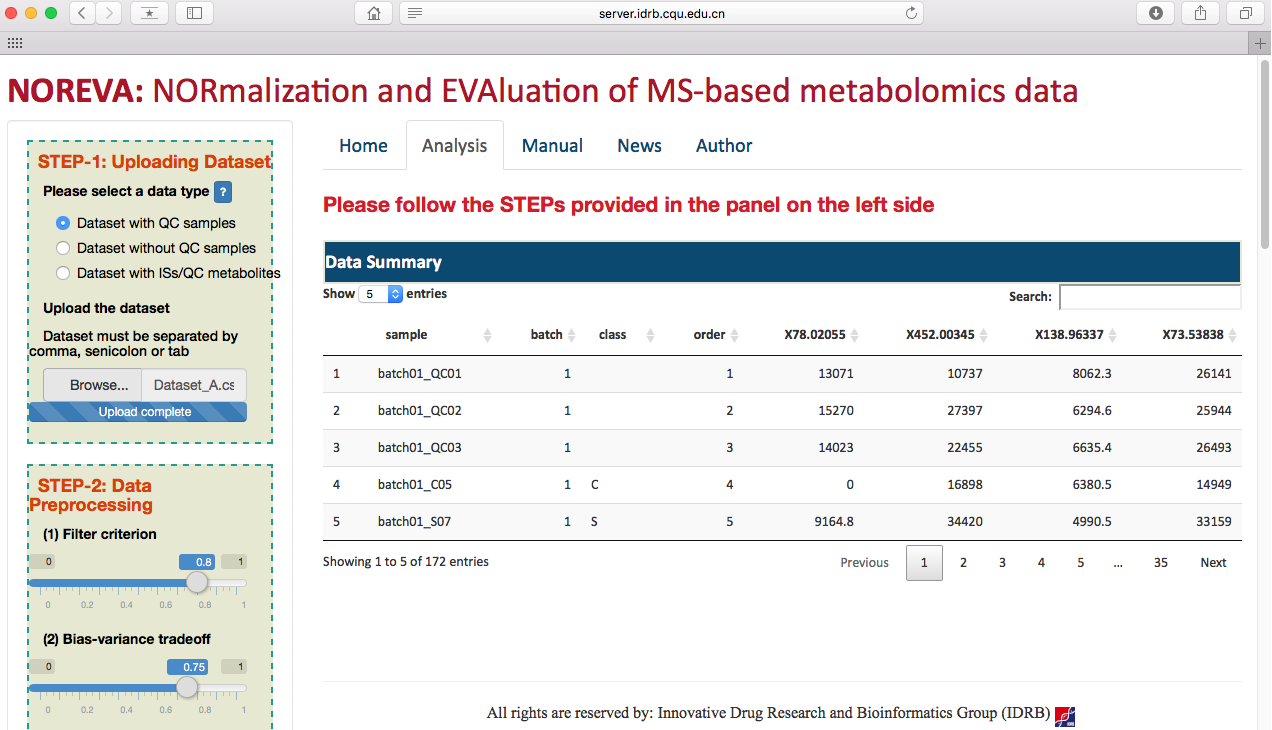
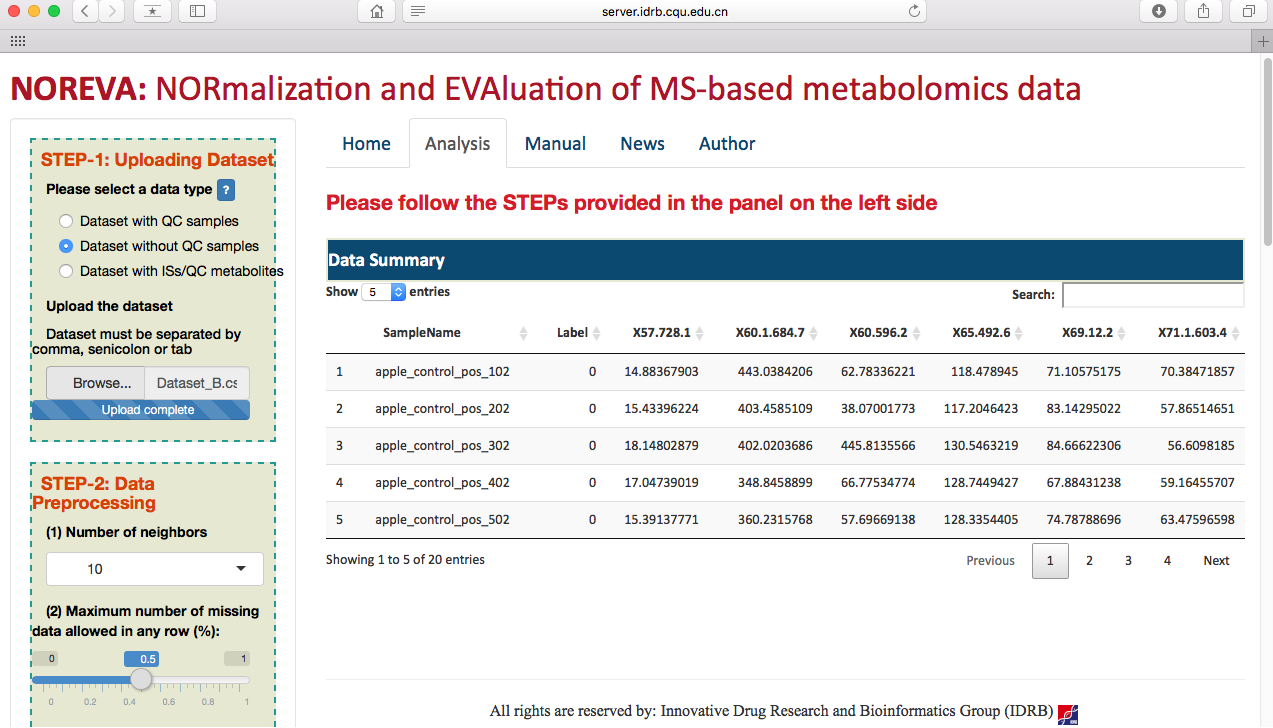
Every metabolomics analysis is started by clicking on the “Analysis” panel on the homepage of NOREVA. Two example datasets together with their corresponding golden standard testing dataset were provided for users’ test. These datasets are benchmark data directly collected from MetaboLights, which included (1) MTBLS79 dataset with QC samples: comprised of 20 cardiac tissue extracts analyzed repeatedly by direct infusion MS (DIMS) in 8 batches across 7 days, together with a concurrent set of QC samples. This set of data was originally designed to test the efficacy of a batch-correction algorithm, and could serve as a benchmark for DIMS metabolomics. (2) MTBLS59 dataset without QC samples: presented the metabolic spectra of apple extracts detected by ultra-performance liquid chromatography MS (UPLC-MS). This dataset consisted of 10 control samples and 3 spiked datasets of the same size, where spiked compounds were added in different concentrations. MTBLS59 could thus be used as benchmark dataset for performance assessment by comparing spiked “true” markers with normalized results.
Operating Procedure Consisting of Four Sequential Steps:
 Uploading the metabolomics dataset
After selecting the corresponding radio checkbox in STEP-1 on the left side of the Analysis page, datasets with or without QC samples or with internal standards can be then directly uploaded (as shown in the following two figures). Besides of the provided example datasets, the input file in correct format can be readily generated based on results of several popular tools such as MetAlign, MZmine, XCMS online and so on. Preview of the uploaded data is subsequently provided on the web page.
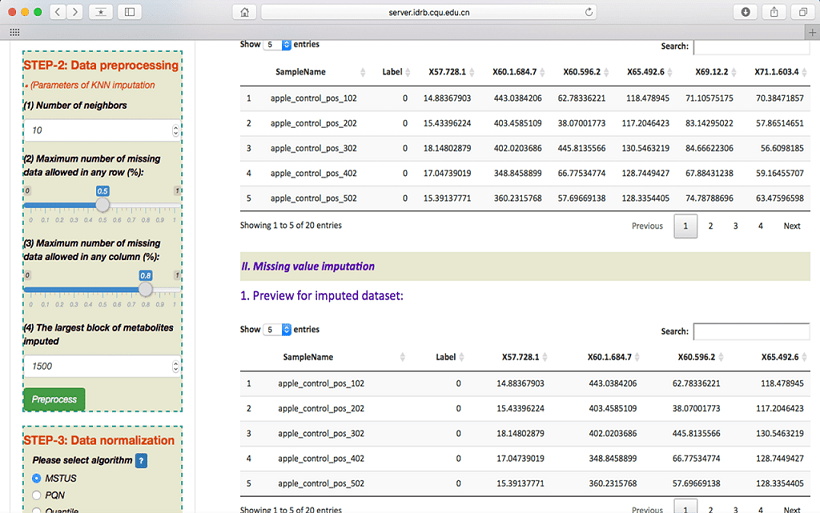
 Preprocessing the metabolomics data
To preprocess the metabolomics data, the QC-based robust LOESS signal correction (QC-RLSC, Nat Protoc. 2011.6(7):1060-83) and missing value imputations are provided. For uploading dataset with QC samples, the users are asked to customize four important parameters including filter criteria, bias-variance tradeoff, regression model and imputation algorithm. The default setting of these parameters can be directly used if users do not want to adjust them according to their preference. For uploading dataset without QC samples, the users are also asked to select four parameters used to adjust KNN imputation, which include number of neighbors, maximum number of missing data allowed in any row (%), maximum number of missing data allowed in any column (%) and the largest block of metabolites imputed. The default settings of these parameters are also provided to the users as a reference.
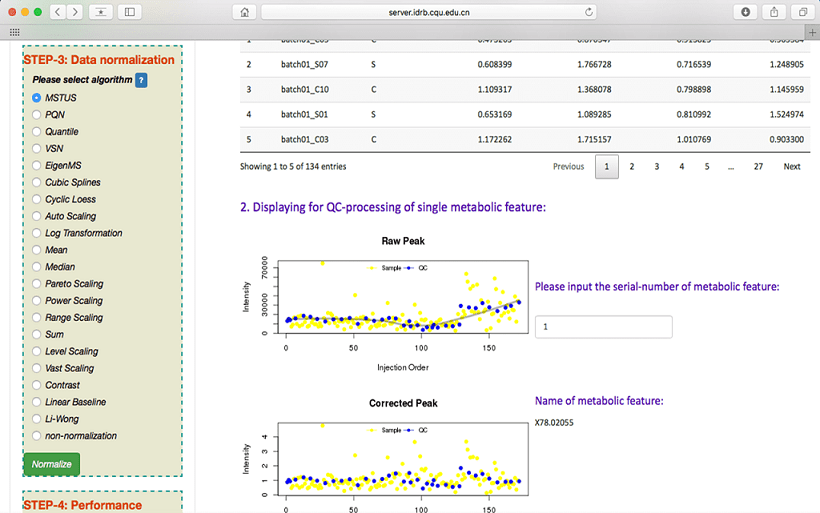
After clicking on the Preprocess button at the end of STEP-2 on the left side of the Analysis page, the uploaded data can be processed based on customized parameters and the resulting data are automatically previewed on the web page. Moreover, the regression curve of metabolite’s intensities among QC samples before normalization and the distribution of metabolite’s intensities among QC samples are visualized. Users can select a specific metabolite for visualization by directly changing the serial number of metabolite. All results after the QC-based signal correction can be fully downloaded by simply clicking on the “QC Report” button.

 Normalization after data preprocessing
NOREVA offers 24 popular normalization methods of analyzing MS-based metabolomics data. Users can select each method by selecting the radio checkbox in STEP-3 on the left side of the Analysis page. A detail explanation on each method is clearly provided before the radio checkboxes of 24 methods. After the normalization, the normalized data can be previewed and downloaded. Data distribution before and after normalization can be visualized in boxplots.
 evaluation of the normalization performance
Five well-established evaluation criteria represented by dozens of measures are provide in NOREVA for a comprehensive evaluation of all methods. These methods include:
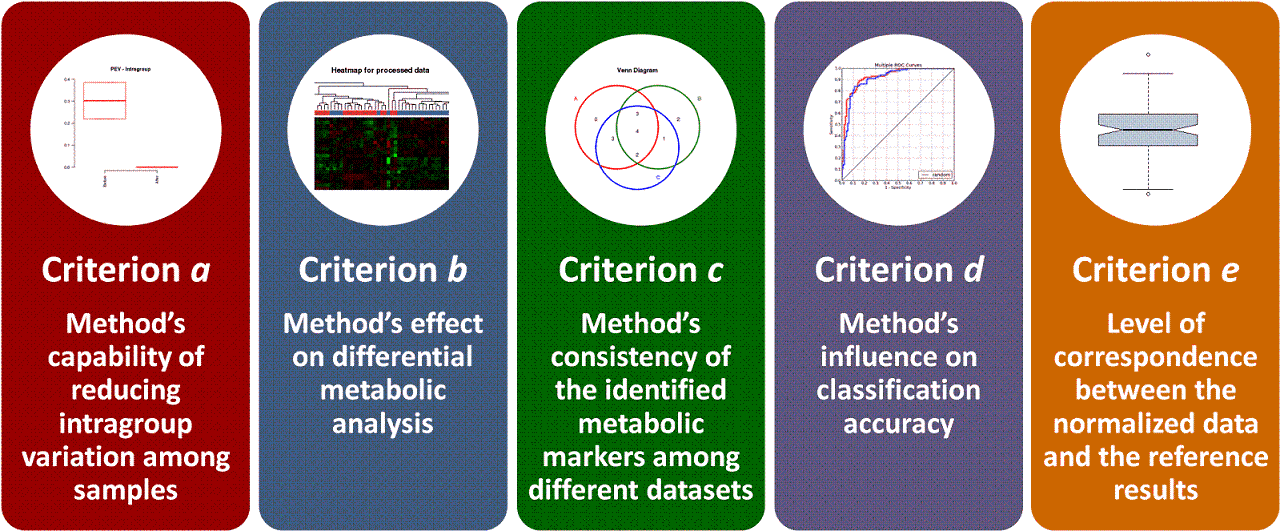
Criterion a: Method’s capability of reducing intragroup variation among samples
Common measures of intragroup variability including pooled coefficient of variation (PCV), pooled estimate of variance (PEV) and pooled median absolute deviation (PMAD) were adopted under this criterion to evaluate variation between samples. The lower value (illustrated by the boxplots) of 3 measures denotes more thorough removal of experimentally induced noise and indicates better performance of the selected method. Moreover, the relative log abundance (RLA) plot used to measure possible variations, clustering tendencies, trends and outliers across groups or within group was also provided. Boxplots of RLA were used to visualize tightness of samples across or within group(s). The median in boxplots would be close to zero and the variation around the median would be low. In addition, principal component analysis (PCA) was also used to visualize the difference across groups. The more distinct group variations indicate better performance of the applied normalization method.
Criterion b: Method’s effect on differential metabolic analysis
The differential significance of metabolites between 2 groups measured by P-values was calculated using limma package. The distribution of P-values and clustering dendrogram & heatmap plots based on differential metabolites were provided. Methods would be considered as well performed when a uniform distribution of P-values and an obvious differentiation between 2 groups in dendrogram and heatmap were both achieved.
Criterion c: Method’s consistency of the identified metabolic markers among different datasets
Under this criterion, a consistency score was defined to quantitatively measure the overlap of identified metabolic markers among different partitions of a given dataset. The higher consistency score represents the more robust results in metabolic marker identification for that give dataset.
Criterion d: Method’s influence on classification accuracy
Under this situation, receiver operating characteristic (ROC) curve together with area under the curve (AUC) values based on support vector machine (SVM) were provided. Firstly, differential metabolic features were identified by partial least squares discriminant analysis (PLS-DA). Secondly, the SVM models were constructed based on these differential features identified. After k-folds cross validation, a method with larger area under the ROC curve and higher AUC value was recognized as well performed.

Criterion e: Level of correspondence between normalized and reference data
Additional experimental data were frequently generated as references to validate or adjust prior result of metabolomics analysis. These references could be spike-in compounds and various molecules detected by quantitative analysis. Here, log fold changes (logFCs) of concentration between 2 groups were calculated, and the level of correspondence between normalized data and references was then estimated. The performance of each method could be reflected by how well the logFCs of normalized data corresponded to what were expected based on references. Moreover, a boxplot illustrating these variations was provided. The preferred median in boxplot would be zero with minimized variations. If this criterion is selected, an additional reference file providing information of golden standard metabolites should be uploaded as a csv file. The format of this file is described in the above “Input File Containing Reference Metabolites as Golden Standards” section.

We really appreciate that you use NOREVA, and your suggestions should be valuable to its improvement. Therefore, if you have any questions and recommendations, please feel free to contact us at Dr. Feng Zhu or Bo Li
College of Pharmaceutical Sciences, Zhejiang University
Hangzhou, P.R. China, 310058.
Contact number: +86-(0)571-8820-8444
College of Pharmaceutical Sciences, Zhejiang University
Hangzhou, P.R. China, 310058.
Contact number: +86-(0)571-8820-8444
Authors for NOREVA 1.0
libcell@cqu.edu.cn
Jing Tangtangj@cqu.edu.cn
Xiaohuan Liuliuxh@cqu.edu.cn
Xuejiao Cuicuixj@cqu.edu.cn
Yuzong Chenphacyz@nus.edu.sg
liyh@cqu.edu.cn
Qingxia Yangyangqx@cqu.edu.cn
Shuang Lilishuang@cqu.edu.cn
Weiwei Xuexueww@cqu.edu.cn
Feng Zhu*zhufeng.ns@gmail.com
Welcome to visit the homepage of our lab IDRB at https://idrblab.org/
We really appreciate that you use NOREVA, and your suggestions should be valuable to its improvement.

College of Pharmaceutical Sciences, Zhejiang University
Hangzhou, P.R. China, 310058.
Contact number: +86-(0)571-8820-8444